A chart title identifies the subject and gives viewers a reason to look. Placed prominently, it supplies context, frames the intended interpretation, and sparks curiosity instead of making users guess. section 6.1.2
Accurate versus meaningful
“Rhinos Poached by Year” names the data, but “The Dramatic Rise of Rhino Poaching” immediately signals a rapid increase and prepares viewers for the chart’s message. section 6.1.2 section 6.1.3
Use a chart title to:
- Set the chart’s context before viewers inspect the marks. section 6.1.2
- Highlight the main pattern or insight without creating confusion or a misleading twist. section 6.1.2
- Serve as the exposition or hook in a visual story, with subtitles and callouts developing the message. section 6.1.3
Figure 6.7 The Dramatic Rise of Rhino Poaching, created by Ash Shih in 2019 for the #MakeoverMonday project. Notice the simple use of color, the way the lines point out the key aspects of the data, and the little touch of decoration, which is the image of a rhino behind the chart, echoing the curve of the line and giving a sense of balance with the callout on the left. I did slightly modify the color of the axis labels and data citation to be a bit brighter so you could see it in print. Check out the original here: http://mng.bz/A8Po. (Ash Shih. Used with permission)
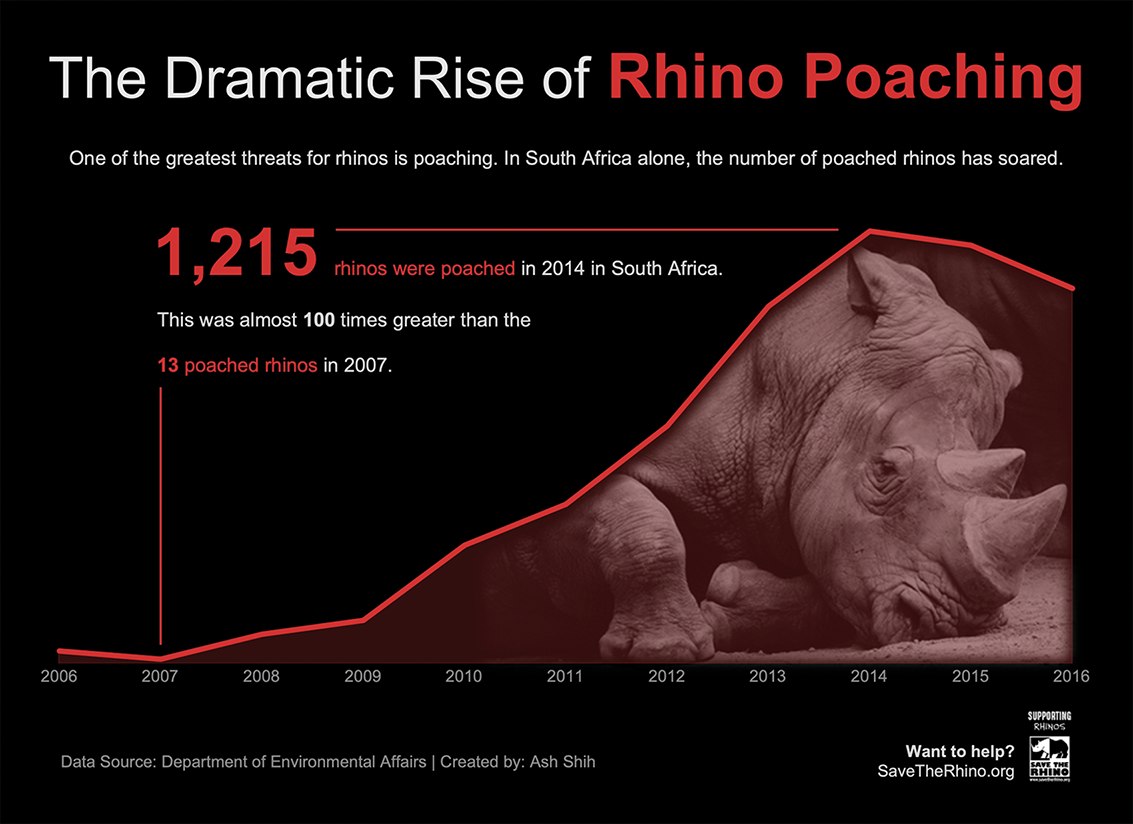
Inspect how the rhino-poaching chart combines a dramatic title with color, directional lines, a callout, and restrained decoration to guide attention. section 6.1.2

