Collective outlier detection finds unusual sets of records rather than only unusual rows. One failed password attempt may be ordinary; many attempts in a short period may not be. Likewise, a series of credit card purchases can be suspicious even when each purchase looks typical. What counts as unusual depends on the process and context, so a flagged collection calls for investigation rather than an automatic conclusion. section 12.0 section 1.4
The central technique is to make a new table whose rows represent the collections of interest: purchasers, products, combinations of entities, days, or other time periods. Calculate features such as transaction counts, sums, means, maximum activity, or hours of activity from the original records. Then apply univariate tests for unusually small or large values, or multivariate detection when combinations of features matter. Choosing the grouping and its features requires domain judgment; a detector cannot choose the relevant metrics on its own. section 12.6 section 12.11
Useful views expose different kinds of collective anomaly:
- Check duplicates, gaps in time or identifiers, and missing combinations. A zero-count staff–product pairing has no row for a point-anomaly detector to flag; compare its absence with how common the staff member and product are overall. section 12.2 section 12.5
- Group by an entity or an entity pair to find unusual behavior or unexpectedly frequent combinations. Existing combinations alone will not reveal combinations that are entirely absent. section 12.6 section 12.6.2
- Group by time to compare periods, or compare the shapes of sequences when every individual value looks normal. The chosen interval affects both how many periods are available for comparison and how stable each period’s statistics are. section 12.6.3 section 17.2.7
Purchases by staff member and product
Start with purchase records containing staff and product IDs, quantities, costs, and timestamps. Extract date components for time-based groupings. For each existing staff–product pair, calculate purchase count and summaries of quantity and cost; compare the resulting rows with an outlier detector. A strongly scored pair is a prompt to inspect its purchasing pattern, not proof of wrongdoing. Separately, a cross-tabulation that includes zero counts can reveal pairs omitted by the existing-pairs aggregation. section 12.2 section 12.6.2 section 12.5
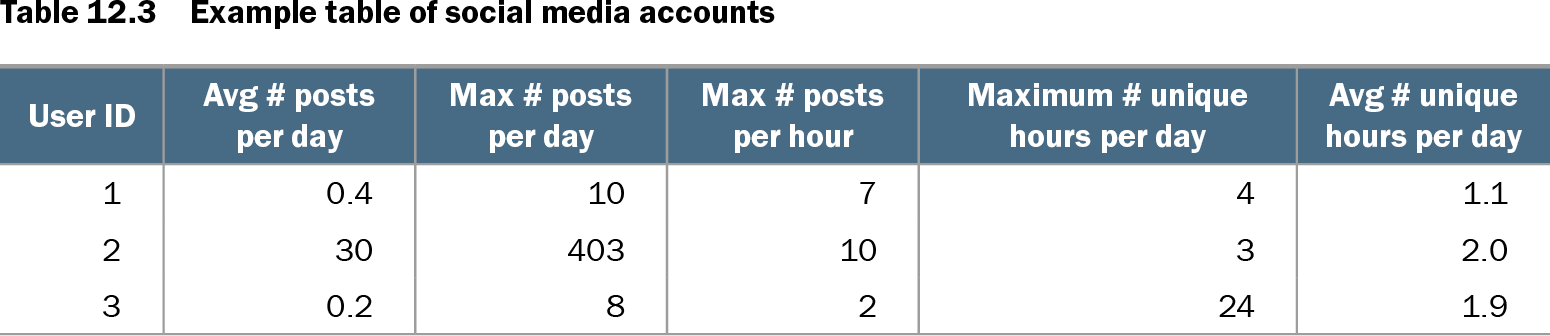
Table 12.3 Example table of social media accounts (view table figure)
| User ID |
Avg # posts per day |
Max # posts per day |
Max # posts per hour |
Maximum # unique hours per day |
Avg # unique hours per day |
|---|---|---|---|---|---|
| 1 |
0.4 |
10 |
7 |
4 |
1.1 |
| 2 |
30 |
403 |
10 |
3 |
2.0 |
| 3 |
0.2 |
8 |
2 |
24 |
1.9 |
An account-level table makes the change of unit visible: each row describes a user’s posting activity, so extreme daily volume or unusually continuous activity can stand out. section 12.6
Test whether the chosen views can detect the behavior of interest. Simulated data can supply known collective anomalies and repeated, plausibly varied test sets; simply duplicating or deleting records may give less clarity about what should be found. Interpret results cautiously: a day with fewer occurrences on the calendar can have a lower total for that reason alone, small groups yield unstable summaries, and examining many groupings raises the chance of uninteresting findings. Additional joined data may expose useful patterns but also create more false positives. section 12.1 section 12.6.3 section 12.6.5