A point anomaly is an unusual individual observation. In a time series, it may be one unexpectedly high or low reading, rather than an unusual sequence of readings. A flagged point is not automatically a fault in the process: the sensor or data collection process may have produced an artifact. section 1.1.5 section 17.2
A sensor spike
An industrial temperature sensor may produce one unusually high reading. Investigate whether it reflects the process or a stressed sensor. An isolated issue may be logged without immediate action; a rising count of point anomalies per minute or hour can justify an alert based on the normal count for that period. section 1.1.5
Choose what makes an individual value unusual before choosing a detector:
- Check the value itself, such as a purchase with an unusual total cost. An individual purchase record can also be unusual because of its time, staff ID, or combination of product and unit cost. Numeric and categorical detectors can provide complementary views. section 12.1
- Check the expected value at that time. Forecast from previous observations, then compare the actual value with the forecast. The forecast error is an outlier score; judge its size against normal forecast errors, for example using their median and median absolute deviation. section 17.2.6
Forecasting can account for recent values, trends, and cycles. If a forecast is 50 and the observation is 240, the error is 190; that is more compelling when ordinary errors are only around 10 or 20. Forecast quality still matters. An ARIMA forecast depends on parameter tuning, while a tree-based predictor can struggle with an upward trend whose future values lie beyond previously seen values. section 17.2.6
Figure 17.12 The same as figure 17.11 but with a single known outlier deliberately added. A dot and dotted vertical line indicate the position of this value. We can see the forecast value is substantially less accurate than normal for this point.
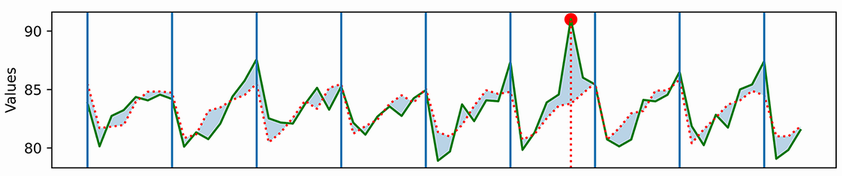
The plotted series contains one deliberately added outlier. Comparing its actual value with the forecast makes the unusually large error visible without treating every ordinary prediction error as an anomaly. section 17.2.6
Point-anomaly checks are only one perspective. A reading may instead be unusual given other sensors or earlier readings, and a group of records may be unusual even when no single record stands out. In purchase data, checking individual transactions and possible data artifacts can precede comparisons of staff, suppliers, products, or time periods. section 1.1.5 section 12.1
