A rare combination is a feature-value combination that appears relatively few times. In multicolumn data, rarity can arise because the individual values are rare or because common values occur together unusually infrequently. section 2.4.1 section 2.4.2
Detect rare combinations from two complementary perspectives:
- Count each observed combination and flag combinations with unusually low counts. This approach becomes less informative as feature cardinality and the number of features increase. section 2.4.1
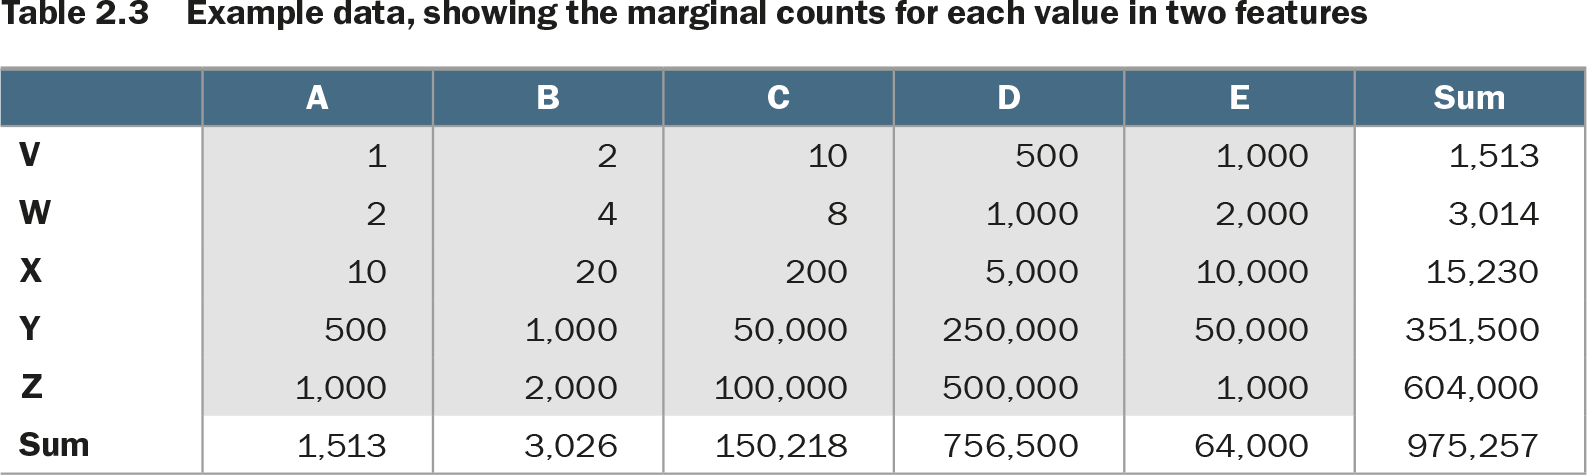
- Compare observed counts with counts expected from the marginal probabilities of each feature. This isolates strictly rare combinations, where individually common values occur together unexpectedly rarely. section 2.4.2
- Aggregate records by entity combinations, such as staff and product, then test the resulting table. The same view can reveal unusually frequent combinations and missing combinations. section 12.6.2
Staff and product purchases
Group purchases by Staff ID and Product ID, calculate count and summary statistics, and score the aggregate rows with Isolation Forest. A staff–product pair with a strongly negative score becomes a candidate for investigation because its frequency and context can be compared with other pairs. section 12.6.2
Table 2.3 Example data, showing the marginal counts for each value in two features (view table figure)
| A |
B |
C |
D |
E |
Sum |
|
|---|---|---|---|---|---|---|
| V |
1 |
2 |
10 |
500 |
1,000 |
1,513 |
| W |
2 |
4 |
8 |
1,000 |
2,000 |
3,014 |
| X |
10 |
20 |
200 |
5,000 |
10,000 |
15,230 |
| Y |
500 |
1,000 |
50,000 |
250,000 |
50,000 |
351,500 |
| Z |
1,000 |
2,000 |
100,000 |
500,000 |
1,000 |
604,000 |
| Sum |
1,513 |
3,026 |
150,218 |
756,500 |
64,000 |
975,257 |
Inspect the two-feature count table and its margins before comparing actual combinations with marginally expected counts. section 2.4.2