A one-dimensional outlier is a value that is unusual within its own column, considered independently of every other column. In numeric data, it is often unusually large or small. section 2.1
Use the distinction between single-value and combination-based unusualness:
- A row can be flagged because it contains one or more one-dimensional outlier values. section 2.3.1
- A one-dimensional check does not detect a combination that is ordinary in every individual feature but rare jointly; that requires multivariate analysis. section 2.3
- Interpret flagged values cautiously: they may be errors, meaningful rare cases, or irrelevant to the investigation. section 8.3
Expense amounts
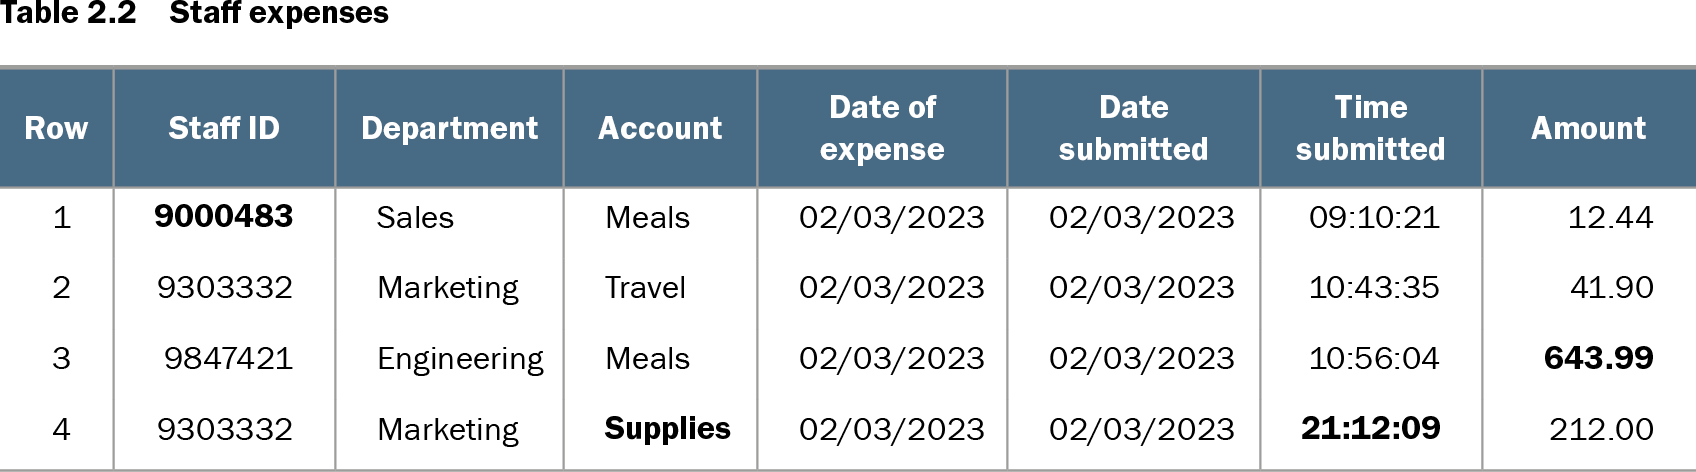
In an expense table, an Amount value of 643.99 may be unusual relative to the other amounts in that column. The row can therefore be flagged for containing a one-dimensional outlier, even before considering its account, time, or department. section 2.1 section 2.3
Table 2.2 Staff expenses (view table figure)
| Row |
Staff ID |
Department |
Account |
Date of expense |
Date submitted |
Time submitted |
Amount |
|---|---|---|---|---|---|---|---|
| 1 |
9000483 |
Sales |
Meals |
02/03/2023 |
02/03/2023 |
09:10:21 |
12.44 |
| 2 |
9303332 |
Marketing |
Travel |
02/03/2023 |
02/03/2023 |
10:43:35 |
41.90 |
| 3 |
9847421 |
Engineering |
Meals |
02/03/2023 |
02/03/2023 |
10:56:04 |
643.99 |
| 4 |
9303332 |
Marketing |
Supplies |
02/03/2023 |
02/03/2023 |
21:12:09 |
212.00 |
Inspect the staff-expense table to compare an unusual amount with the other row features that may support multivariate analysis. section 2.3