A multivariate outlier is a table row whose combination of feature values is rare, even when the individual values are not unusual. Unlike a univariate outlier, it evaluates relationships among multiple features, making it useful for finding unusual purchases, records, or observations. section 2.3
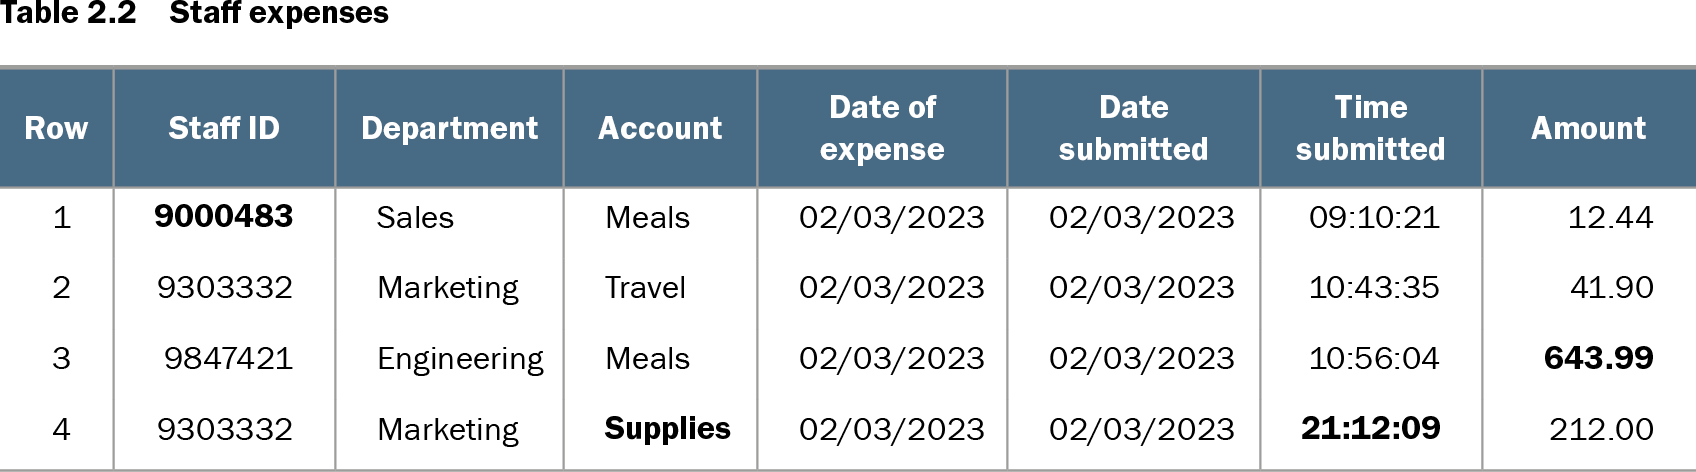
Table 2.2 Staff expenses (view table figure)
| Row |
Staff ID |
Department |
Account |
Date of expense |
Date submitted |
Time submitted |
Amount |
|---|---|---|---|---|---|---|---|
| 1 |
9000483 |
Sales |
Meals |
02/03/2023 |
02/03/2023 |
09:10:21 |
12.44 |
| 2 |
9303332 |
Marketing |
Travel |
02/03/2023 |
02/03/2023 |
10:43:35 |
41.90 |
| 3 |
9847421 |
Engineering |
Meals |
02/03/2023 |
02/03/2023 |
10:56:04 |
643.99 |
| 4 |
9303332 |
Marketing |
Supplies |
02/03/2023 |
02/03/2023 |
21:12:09 |
212.00 |
Use the staff-expense table to inspect how account, time, department, and amount can jointly define an unusual purchase. section 2.3
Rows can be flagged for several related reasons:
- One or more individually rare values make the row unusual. section 2.3.1
- A rare combination makes the row unusual, although neither value is rare alone; this also applies to categorical combinations. section 2.3.1
- Several moderately rare values or combinations can jointly justify investigation. section 2.3.1
Interpretation requires more than a score. One-dimensional plots can look nonsensical when anomalies exist only in higher-dimensional combinations; two-dimensional plots or categorical heatmaps may clarify some cases, but higher-dimensional outliers require examining more features. section 8.1.2
Explaining a flagged row
Isolation Forest may detect multivariate anomalies that ECOD misses. ECOD can still provide partial explanations by showing which features are most anomalous, while CountsOutlierDetector can expose unusual value combinations, such as a pair that occurs only 18 times despite common individual values. section 15.2.2
For strongly seasonal data, reshape each period into one row whose columns represent positions within that period. Standard multivariate tabular detection can then identify unusual periods, such as unusual weeks. section 17.2.8