Structured data
Structured data is information organized according to a defined schema or arrangement that makes its elements and relationships consistently interpretable and processable.

Machine Learning for Tabular Data: XGBoost, Deep Learning, and AI
Data organized according to a defined schema that makes its elements consistently interpretable and manageable.
- How it is used
- Positions structured tables as the business-data foundation for analysis, reporting, and machine-learning prediction.
- How deep it goes
- Defines rows, columns, observations, features, types, formats, and pandas representation without surveying non-tabular structured formats in detail.
- Examples
- Uses currency records, a four-person pandas DataFrame, Airbnb listings, and Kuala Lumpur property records.
- What you can do after
- Evaluate/understand whether data is tabular, identify its rows, columns, and value types, and inspect it for modeling.

Build an AI Agent (From Scratch)
Data organized according to a defined schema with predictable fields, types, or relationships.
- How it is used
- Uses structured output to connect agent actions, final answers, evaluation, and memory to downstream software.
- How deep it goes
- Implements schema-based API responses and extends an agent’s tool setup, completion detection, and result extraction.
- Examples
- Uses contact extraction, sentiment analysis, GAIA answer records, and problem-solving memories as structured artifacts.
- What you can do after
- Apply it via Pydantic and LiteLLM to request schema-shaped responses and return validated agent results.
Read how Build an AI Agent (From Scratch) explains structured data →

Bayesian Optimization in Action
Structured data is data organized according to meaningful internal arrangement, relationships, or spatial structure rather than as an unstructured collection of independent values.
- How it is used
- Frames images, molecules, and constrained values for modeling with Gaussian processes and learned feature representations.
- How deep it goes
- Defines structural constraints, explains kernel failures, and develops neural feature extraction without detailing the underlying neural-network internals.
- Examples
- Uses house constraints, MNIST images, molecular graphs, drug-effectiveness prediction, and a vanilla-versus-combined GP comparison.
- What you can do after
- Build combined neural-network and Gaussian-process models that learn continuous features from structured inputs and quantify predictive uncertainty.
Read how Bayesian Optimization in Action explains structured data →

Domain-Specific Small Language Models
A prompting/API feature that constrains a model’s response to match a declared JSON schema.
- How it is used
- Constrains entity and relationship extraction into a parseable format before knowledge-graph construction.
- How deep it goes
- Shows a Pydantic schema and Ollama chat configuration, but does not explain the constraint mechanism’s internals.
- Examples
- Uses two-list entity and relationship responses, with observed formatting-error rates of about 6% and 25% before schema constraints.
- What you can do after
- Apply it via Ollama’s chat API and a Pydantic class to obtain consistently formatted graph-extraction responses.
Read how Domain-Specific Small Language Models explains structured data →

The Art of AI Product Development
Structured data is information organized according to a defined schema that supports systematic querying and processing.
- How it is used
- Uses structured data to make language-model outputs reusable and to support querying in agent workflows.
- How deep it goes
- Explains prompting, generation constraints, and validation options, but stops short of implementation details.
- Examples
- Uses a JSON company overview and product usage data to illustrate structured output and querying.
- What you can do after
- Apply it by specifying output fields in a prompt and choosing controls for stricter schema adherence.
Read how The Art of AI Product Development explains structured data →

Practices of the Python Pro
- How it is used
- Organizes bookmark records for storage, retrieval, filtering, sorting, and other persistence-layer operations.
- How deep it goes
- Demonstrates schemas and CRUD queries in SQLite, stopping short of broader database design.
- Examples
- Uses a bookmarks table containing identifiers, titles, URLs, notes, and dates.
- What you can do after
- Operate tabular data through Python’s sqlite3 connection and parameterized SQL queries.
Read how Practices of the Python Pro explains structured data →
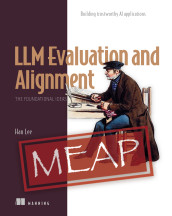
LLM Evaluation and Alignment, The Foundational Ideas
A structured database is an organized store of data whose records and fields follow a defined schema.
- How it is used
- Evaluates retrieval quality when AI systems query structured databases for context.
- How deep it goes
- Distinguishes completeness, execution accuracy, and task success, but does not detail database schema or query implementation.
- Examples
- Uses SQL queries that return correct records as the central evaluation artifact.
- What you can do after
- Diagnose database-backed retrieval by measuring completeness, query execution accuracy, and overall task success.
Read how LLM Evaluation and Alignment, The Foundational Ideas explains structured data →
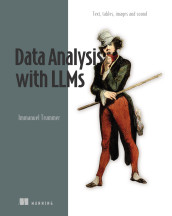
Data Analysis with LLMs
Data organized according to a predefined schema, such as tables with named rows and columns or graphs with entities and relationships.
- How it is used
- Uses structured data as the target of natural-language questions translated into queries for specialized processing tools.
- How deep it goes
- Explains data formats and the question-to-query workflow, while deferring detailed treatment of SQL and Cypher.
- Examples
- Uses customer tables, social networks, and a survey-results prompt that requests SQL for questions about respondents.
- What you can do after
- Build it from scratch: provide a question and database structure to generate a query, then check it before execution.

Elasticsearch in Action, Second Edition
Structured data is information organized according to a predefined schema or consistent fields and types.
- How it is used
- Supports exact filtering of organized fields when relevance ranking is not needed.
- How deep it goes
- Defines schemas and binary matching, then names term-level query families without detailing their implementation.
- Examples
- Uses canceled flights, bestseller books, user activity, and London crime dates to illustrate exact and range matching.
- What you can do after
- Apply it via Elasticsearch term-level queries to filter numbers, keywords, Booleans, and dates exactly.
Read how Elasticsearch in Action, Second Edition explains structured data →
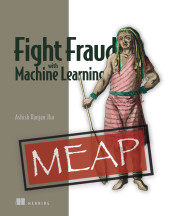
Fight Fraud with Machine Learning
Structured data is data organized according to a predefined schema, typically in fields, records, or tables.
- How it is used
- Classifies fraud-detection inputs and guides whether to use rules, machine learning, or deep learning.
- How deep it goes
- Defines structured data as tabular records and contrasts it with unstructured and semi-structured modalities without detailing model internals.
- Examples
- Uses credit-card transactions, phishing metadata, and identity-fraud metadata such as IP addresses, times, click frequency, and typing speed.
- What you can do after
- Apply modality distinctions to select a fraud-detection approach and recognize when metadata remains structured.
Read how Fight Fraud with Machine Learning explains structured data →

DuckDB in Action
Tabular data is information organized into rows and columns representing records and fields.
- How it is used
- Structures ingested records for exploration, transformation, SQL analysis, persistence, and downstream delivery.
- How deep it goes
- Defines rows, named columns, data types, schemas, keys, normalization, and structural evolution, but defers general database design detail.
- Examples
- Uses energy systems, readings, and prices; ATP match CSV files; and Stack Overflow XML converted through JSON into CSV.
- What you can do after
- Operate tabular workflows by loading files, creating and evolving tables, validating results, and scheduling DuckDB transformations.

Build AI-Enhanced Web Apps
Structured data is data organized according to an explicit schema or predictable structure that enables machine processing.
- How it is used
- Uses schema-validated AI output to supply product data for a web application's table.
- How deep it goes
- Walks through a server action and client handler, then troubleshoots an unsupported structured-output method.
- Examples
- Uses a product-category table and a structured-output call that fails when JSON mode is requested.
- What you can do after
- Apply it via the Vercel AI SDK's generateObject helper and diagnose unsupported output methods in a LangChain.js integration.
Read how Build AI-Enhanced Web Apps explains structured data →

Outlier Detection in Python
Tabular data is data organized into rows and columns, typically representing records and their attributes.
- How it is used
- Supports outlier detection and data understanding across business, scientific, medical, economic, weather, and server-log data.
- How deep it goes
- Explains row and feature design through aggregation, temporal feature engineering, and period reshaping, but defers detector-specific theory.
- Examples
- Uses social-media account summaries, historical time-series features, and weekly tables containing one row per period.
- What you can do after
- Apply it via engineered tables that expose unusual entities, records, or time windows to standard outlier detectors.
Read how Outlier Detection in Python explains structured data →

AI-Powered Search
Structured data is information organized according to a predefined schema that supports direct querying and consistent field-based operations.
- How it is used
- Supports direct querying and explicit joins before comparing relational structure with relationships discovered in unstructured search data.
- How deep it goes
- Explains rows, columns, data types, foreign keys, and joins, then stops short of detailed SQL query syntax.
- Examples
- Uses employee and company tables, shared identifiers, and document relationships based on common or resolved entity references.
- What you can do after
- Evaluate how schemas, data types, foreign keys, and joins make records queryable and relationships explicit.
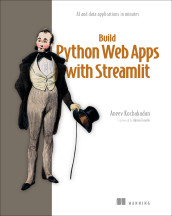
Build Python Web Apps with Streamlit
Structured Outputs is an OpenAI API feature that constrains a model response to conform to a developer-provided schema.
- How it is used
- Structures LLM responses for reliable parsing and application logic in an AI-powered Streamlit application.
- How deep it goes
- Explains schemas, typed validation, parsing, and usage, but defers the internals of inheritance and Pydantic implementation.
- Examples
- Uses a Pydantic AnswerEvaluation model and a quiz interface that evaluates answers and displays the correct response.
- What you can do after
- Build it with Pydantic and the OpenAI parsing endpoint, then consume validated fields in application logic.
Read how Build Python Web Apps with Streamlit explains structured data →

AI Agents in Action, Second Edition
Data organized according to an explicit format or schema that makes its contents and relationships readily evaluable.
- How it is used
- Uses explicit schemas to make agent responses evaluable, parseable, and suitable for downstream control flow.
- How deep it goes
- Builds typed models and handles strict-JSON failures, but does not descend into serialization internals.
- Examples
- Demonstrates research plans, typed research iterations, nested subtopic updates, and five-task JSON-like outputs.
- What you can do after
- Build it from scratch as typed agent output that code can validate, inspect, and use for loop decisions.
Read how AI Agents in Action, Second Edition explains structured data →

Effective Data Analysis
Structured data is information organized according to a predefined format that enables consistent storage, retrieval, and processing.
- How it is used
- Uses predefined formats and analytics schemas to make organizational data easier to clean, query, reuse, and interpret.
- How deep it goes
- Explains transformation, cleaning, aggregation, and modeling practices, but stops short of specifying a universal schema or implementation.
- Examples
- Uses scraped websites, competitor prices, social media trends, messy tables, cleaned tables, and multi-source analytics schemas.
- What you can do after
- Evaluate/understand how data structure affects analytical efficiency and contribute to more reusable, accurate organizational datasets.

Data Without Labels
A structured dataset organizes values according to a predefined schema, commonly in rows and columns.
- How it is used
- Supports analysis, visualization, and many machine-learning algorithms through a row-column representation.
- How deep it goes
- Defines the row-column format and gives a transaction example, but stops short of implementation or storage details.
- Examples
- Uses retail transactions containing customer ID, date, amount, item count, payment mode, and city.
- What you can do after
- Evaluate/understand whether data fits a row-column structure and distinguish it from unstructured data.
Snowflake Data Engineering
Structured data is data organized according to a fixed schema or predictable tabular structure.
- How it is used
- Uses fixed fields and rows to make ingested or extracted information queryable in Snowflake.
- How deep it goes
- Defines tabular organization and demonstrates extraction into columns, but stops short of formal schema design.
- Examples
- Uses customer order emails, CSV files, cloud-stored JSON and Parquet, and an orders table with item quantities.
- What you can do after
- Apply it via Snowflake tables and pipelines to query extracted orders or ingest structured files for analysis.
Read how Snowflake Data Engineering explains structured data →
Building Specialized AI Systems
Structured input is information represented in consistent fields or formats that preserve identifiable numerical or categorical attributes.
- How it is used
- Uses consistent financial fields to train specialized models for precise, explainable business decisions.
- How deep it goes
- Explains field consistency, intermediate calculations, and reasoning trails, but stops short of implementation code or schema design.
- Examples
- Uses income, debt, credit score, late payments, DTI calculation, and high-risk classification in a credit-risk record.
- What you can do after
- Apply it via fine-tuning to teach models consistent domain relationships and reproduce explainable decision logic.
Read how Building Specialized AI Systems explains structured data →

The Quick Python Book, Fourth Edition
Tabular data is data organized into rows and columns representing records and fields.
- How it is used
- Processes files and database tables when records must be read, cleaned, transformed, stored, queried, or updated.
- How deep it goes
- Defines rows, records, fields, and delimiters, then demonstrates table creation, parameterized queries, updates, commits, and ORM mapping.
- Examples
- Uses delimited files, a SQLite people table, parameterized inserts, filtered queries, row updates, and SQLAlchemy table objects.
- What you can do after
- Operate/configure SQLite or SQLAlchemy workflows that create tables, insert records, query rows, update values, and commit changes.
Read how The Quick Python Book, Fourth Edition explains structured data →

Deep Learning with PyTorch, Second Edition
Data organized as rows and columns where each row is treated as an independent record without inherent temporal order.
- How it is used
- Frames spreadsheets, CSV files, and databases as independent samples to prepare for neural-network input.
- How deep it goes
- Defines rows, columns, heterogeneous types, and numeric tensor encoding, then stops before model training.
- Examples
- Uses a twelve-column wine-quality CSV containing chemical measurements and sensory scores.
- What you can do after
- Build it from scratch by encoding heterogeneous table columns as floating-point tensor values ready for a neural network.
Read how Deep Learning with PyTorch, Second Edition explains structured data →

D3.js in Action, Third Edition
Tabular data is data organized into rows and columns, with each row representing a record and each column representing a field.
- How it is used
- Structures datasets for loading, measuring, reorganizing, and binding rows to visualization elements.
- How deep it goes
- Explains rows, headers, delimiters, D3 loaders, and asynchronous access, then stops short of deeper data modeling.
- Examples
- Uses an employee dataset expressed as CSV, TSV, and pipe-delimited DSV files.
- What you can do after
- Apply it via D3 loaders to access, convert, and prepare tabular data for visualization.
Read how D3.js in Action, Third Edition explains structured data →

AI for Everyday IT
Structured output is a model response constrained to a specified format or schema so that its contents can be processed predictably.
- How it is used
- Turns specified task details or function requirements into data that can be fitted to templates or processed by applications.
- How deep it goes
- Traces schema-defined JSON from function payloads through parsing to application use.
- Examples
- Uses a project plan with dates and risks, plus generated SQL and a separate safety check.
- What you can do after
- Build an application flow that defines expected JSON, parses returned fields, and uses or checks a generated SQL query.

AI Agents and Applications
A table is structured data arranged into rows and columns, typically representing related records or values.
- How it is used
- Improves retrieval systems by supplying precise records when vector search alone provides insufficiently relevant context.
- How deep it goes
- Explains source routing, query generation, table extraction, summary embeddings, storage, and retrieval, but not database internals.
- Examples
- Uses mixed documents containing tables, table summaries, document stores, vector stores, and MultiVectorRetriever.
- What you can do after
- Apply it via multi-store routing, generated SQL, table-summary embeddings, and MultiVectorRetriever-based retrieval.
Read how AI Agents and Applications explains structured data →
Grokking AI Applications
Structured data is information organized according to a predefined schema of fields, records, tables, or other machine-readable structures.
- How it is used
- Extends LLM applications beyond conversation by processing company data through repeatable input and output workflows.
- How deep it goes
- Explains schemas, record-wise prompting, and output reformatting as the interface between data systems and LLM reasoning.
- Examples
- Uses CRM customer records with fields for age, name, and recent purchases.
- What you can do after
- Apply it via KNIME to connect structured data systems with LLM prompts and transformed outputs.
Read how Grokking AI Applications explains structured data →
Enterprise RAG
Structured data is information organized according to a predefined schema, such as rows and fields in database records.
- How it is used
- Prepares SQL records for flexible retrieval in enterprise RAG and hybrid search systems.
- How deep it goes
- Traces ingestion from batched database queries through transformation, embedding, upload, and synchronization, without implementation code.
- Examples
- Uses batched SQL records that are summarized, cleaned, embedded, packaged, uploaded, updated, and deleted in the search index.
- What you can do after
- Apply it via Azure AI Search to build searchable representations of SQL records for hybrid retrieval.
Everyday Data Visualization
Data organized into rows and columns according to a shared set of fields.
- How it is used
- Supports visualization work by organizing dimensions, measures, and observations into tables that BI tools can use.
- How deep it goes
- Defines rows, columns, and grain, then connects them to joins and aggregations without detailing database implementation.
- Examples
- Uses banking transaction, daily summary, account snapshot, and fruit-tasting tables to illustrate grain and aggregation.
- What you can do after
- Evaluate tables by identifying their grain and apply SQL concepts such as joins and aggregations to visualization data.
Read how Everyday Data Visualization explains structured data →
Machine Learning Platform Engineering
Structured data is data organized according to a defined schema that makes its fields and relationships machine-readable.
- How it is used
- Supports production recommendation pipelines by making collection, storage, validation, training, and monitoring operationally manageable.
- How deep it goes
- Explains storage, splitting, quality checks, and tooling integrations, but defers data exploration and recommendation algorithm details.
- Examples
- Uses the MovieLens dataset, Parquet files, MinIO storage, train-test-validation splits, and a movie recommendation pipeline.
- What you can do after
- Apply it via a reproducible pipeline that prepares, validates, stores, and supplies structured datasets for model training.
Read how Machine Learning Platform Engineering explains structured data →
Claude at Work
Structured data is information organized according to a defined schema that makes its fields and records machine-readable.
- How it is used
- Uses structured datasets as inputs for Claude-assisted exploration and correlation research.
- How deep it goes
- Shows CSV data paired with JSON field descriptions and Markdown read-me files, without detailing schema design.
- Examples
- Downloads datasets on internet use, researchers, and space launches to prompt correlation questions.
- What you can do after
- Apply it via Claude Cowork to inspect local dataset ZIPs and investigate correlations among measures.

Practical Automation with PowerShell: Effective scripting from the console to the cloud
Structured data is information organized according to an explicit schema or representation with identifiable fields and relationships.
- How it is used
- Uses structured data to update automation inputs safely and repeatably through PowerShell objects.
- How deep it goes
- Explains object-based XML updates, property targeting, encoding, and output, while stopping short of general schema design.
- Examples
- Demonstrates editing Autounattend.xml for a zero-touch ISO, including administrator-password encoding and installation-image selection.
- What you can do after
- Apply it via PowerShell to modify XML or JSON properties without relying on unsafe text replacement.
Also covered in
- A Pythonic Adventure: From Python basics to a working web app
- Essential GraphRAG
- Just Use Postgres!
- Software Testing with Generative AI
- Knowledge Graphs and LLMs in Action
- The Well-Grounded Data Analyst
- Learn PowerShell Scripting in a Month of Lunches, Second Edition: Write and organize scripts and tools
- Inside Deep Learning: Math, Algorithms, Models
- Graph Neural Networks in Action
- Learn AI Data EngineeringIn early access (MEAP)
- Architecting for AutonomyIn early access (MEAP)
- Investing for Programmers
What to know first
- language modelA language model is a computational model that represents patterns in linguistic sequences to assign probabilities, predict, generate, or evaluate language.
- JSONJSON is a language-independent text-based data-interchange format that represents structured values using objects, arrays, strings, numbers, booleans, and null.
- SQLSQL is a standardized declarative language for defining, querying, and manipulating data in relational database systems.
- CSVCSV is a text format for tabular data in which records contain fields separated by commas, with conventions for quoting fields that contain special characters.
Related concepts
- schemapart of · A data schema is a formal specification of the structure, fields, types, relationships, and constraints of data.
- large language modelused by · A large language model is a machine-learning model trained on extensive text data to process and generate natural language.
- database tablekind of · A database table is a relational data structure that organizes records into rows whose values correspond to defined columns.
- datakind of · Data is recorded or represented information, observations, measurements, or values that can be stored, processed, communicated, or interpreted.
- unstructured datacontrasts with · Unstructured data is information that lacks a fixed, predefined schema or consistently organized fields or records.
- JSONuses · JSON is a language-independent text-based data-interchange format that represents structured values using objects, arrays, strings, numbers, booleans, and null.
Questions about structured data
What is structured data?
Structured data is information organized according to a defined schema or arrangement that makes its elements and relationships consistently interpretable and processable.
Which Manning books explain structured data?
Machine Learning for Tabular Data: XGBoost, Deep Learning, and AI, Build an AI Agent (From Scratch), Bayesian Optimization in Action, Domain-Specific Small Language Models, The Art of AI Product Development, Practices of the Python Pro, LLM Evaluation and Alignment, The Foundational Ideas, Data Analysis with LLMs and 23 more.
What should I know before learning structured data?
Manning books that teach structured data usually introduce language model, JSON, SQL and CSV first.
What is the difference between structured data and unstructured data?
Structured data is information organized according to a defined schema or arrangement that makes its elements and relationships consistently interpretable and processable. Unstructured data is information that lacks a fixed, predefined schema or consistently organized fields or records.
What is structured data a kind of?
Structured data is a kind of database table. A database table is a relational data structure that organizes records into rows whose values correspond to defined columns.
What is structured data part of?
Structured data is part of schema. A data schema is a formal specification of the structure, fields, types, relationships, and constraints of data.
These guides are generated from the text of Manning books by Manning's knowledge graph and link to the sections they draw on. The full books are available on liveBook and at manning.com.