Structured data follows a predefined format, such as consistent rows, columns, or tables, so it can be stored, retrieved, transformed, and analyzed more efficiently. section 10.2 section 11.0
Its practical value appears in analytics: well-structured data reduces repetitive cleaning, joining, filtering, and query work, allowing analysts and stakeholders to focus on insights and decisions. section 11.0 section 11.4
Creating useful structured data commonly involves:
- Extracting information from unstructured or semi-structured sources and transforming it into an analyzable format. section 10.2
- Correcting mismatches, missing records, and incorrect records across data sources. section 11.4
- Combining, aggregating, or denormalizing relevant information into cohesive analytics schemas. section 11.4
- Designing tables around how an organization and its stakeholders work, rather than treating available data as automatically usable. section 11.1 section 11.4
Figure 11.3 The same data as in figure 11.2, after it’s been cleaned and structured for analysis.
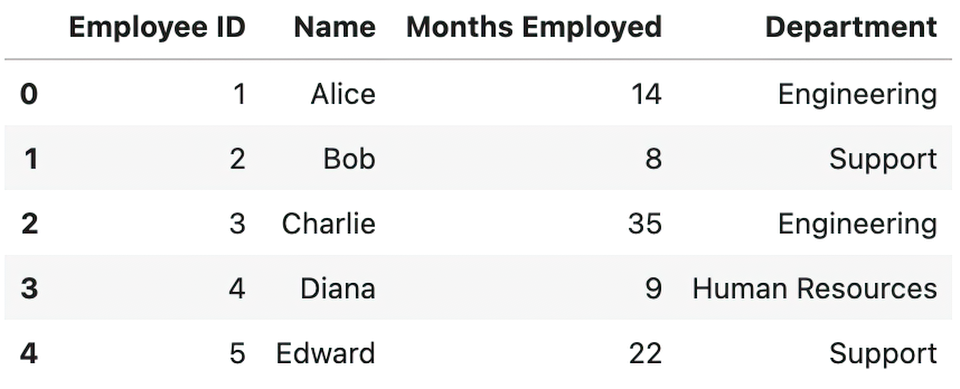
Compare messy, non-tabular information with the same information after cleaning and structuring for analysis. section 11.1
Figure 11.18 Creating tables in analytics schemas involves synthesizing and aggregating multiple sources into one place to reduce time, effort, and inaccuracies when using data.
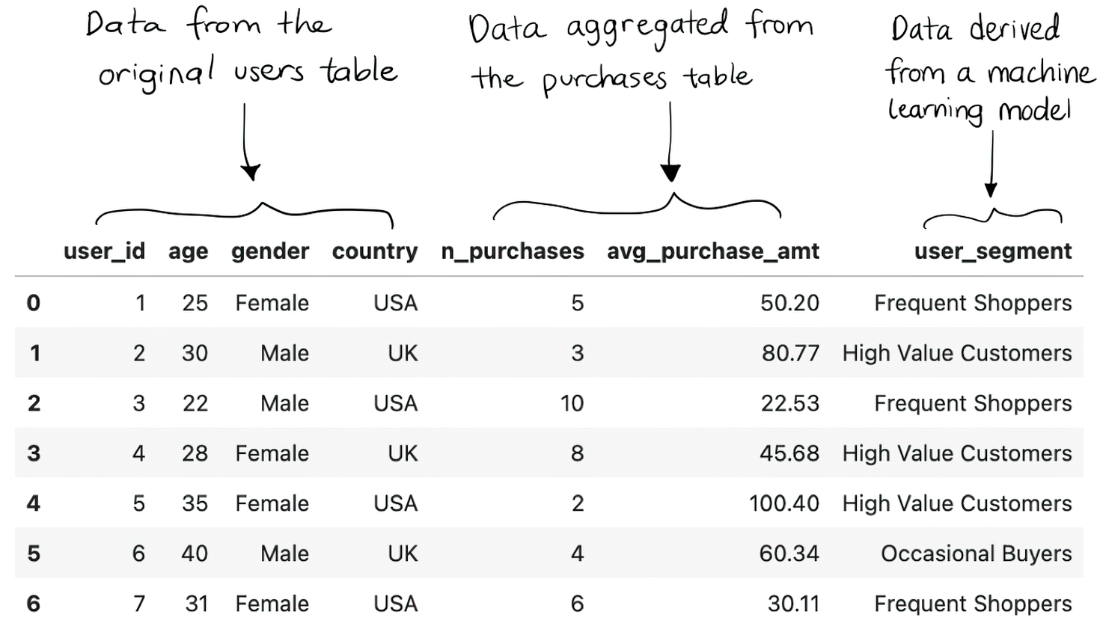
See how multiple sources are synthesized and aggregated into analytics tables to reduce effort and inaccuracies. section 11.4