Structured data organizes values according to a defined format so they can be consistently entered, retrieved, managed, and analyzed. Tabular data is a common structured form: a matrix of rows and columns in which each row describes one observation and each column records one attribute. The terms are related but not identical: structured data can also include partly structured formats such as nested JSON. section 1.1 section 1.2 section 1.6
In a table, columns have compatible data types, while different columns may represent different kinds of information. A currency table, for example, can combine categorical fields such as country and ISO code, free-form text such as a currency nickname, and a continuous field such as units per US dollar. Common physical homes for this data include CSV and spreadsheet files and relational-database tables. section 1.1
Treat a usable tabular dataset as a set of identifiable observations and well-described attributes:
- Make each row represent a distinct observation or condition rather than an unrelated collection of values. section 1.1
- Assign appropriate representations to numeric, ordinal, categorical, date, text, and binary values. section 2.1.3
- Use column values as features or variables; use joining keys when relational tables must be combined. section 1.1 section 2.1
- Inspect dimensions, unique-value counts, descriptive statistics, and missing values before modeling. section 9.1
A small people table in pandas
A pandas DataFrame can represent four people as labeled rows and their gender, age, education level, and income as columns. Labels or numeric positions can retrieve a row, while DataFrame operations can slice, aggregate, reshape, handle missing values, and visualize the table. This makes the table a practical bridge between stored business data and analysis in Python. section 2.1.3
Figure 1.1 An example of tabular data
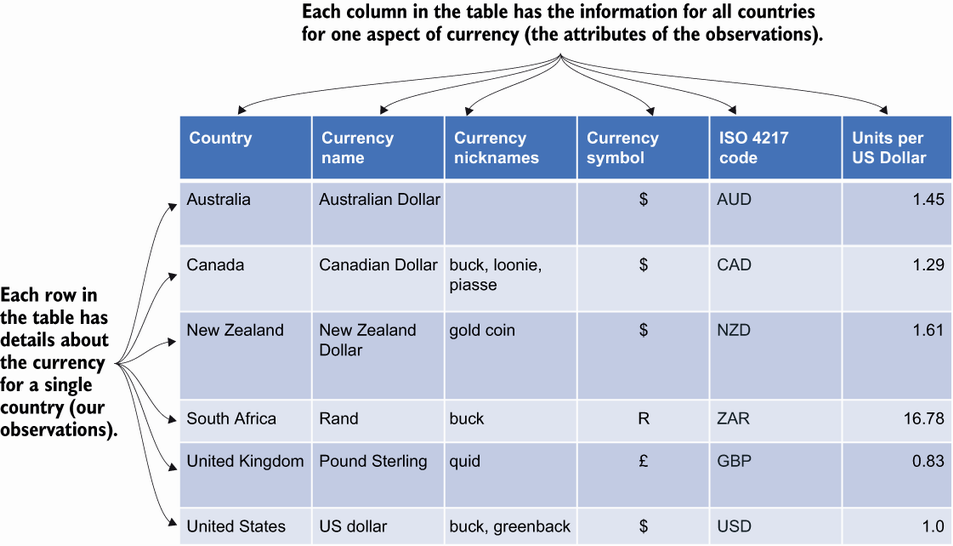
The table visualization makes the row-as-observation and column-as-attribute structure concrete, while also showing that columns may use different value types. section 1.1
Structured tables support operational systems and analysis across banking, retail, government, manufacturing, and other domains. They also supply machine-learning inputs for tasks such as inventory forecasting, commodity-price prediction, listing-price classification, and real-estate prediction. For tabular prediction problems, classical machine learning and deep learning are alternatives to compare for simplicity, transparency, and efficacy rather than interchangeable defaults. section 1.0 section 1.2 section 3.0