Structured data organizes observations into rows and features into columns. In tabular form, each row can represent a record, entity, time period, or summarized collection of original records. section 1.3 section 12.6
Tabular structure makes unusual records easier to examine with standard univariate and multivariate outlier detection. Its usefulness depends on choosing features that expose the behavior or context of interest; flagged rows still require interpretation. section 1.3 section 12.6
Useful tabular representations include:
- Entity summaries, where each row aggregates many original records and each feature captures a relevant statistic. section 12.6
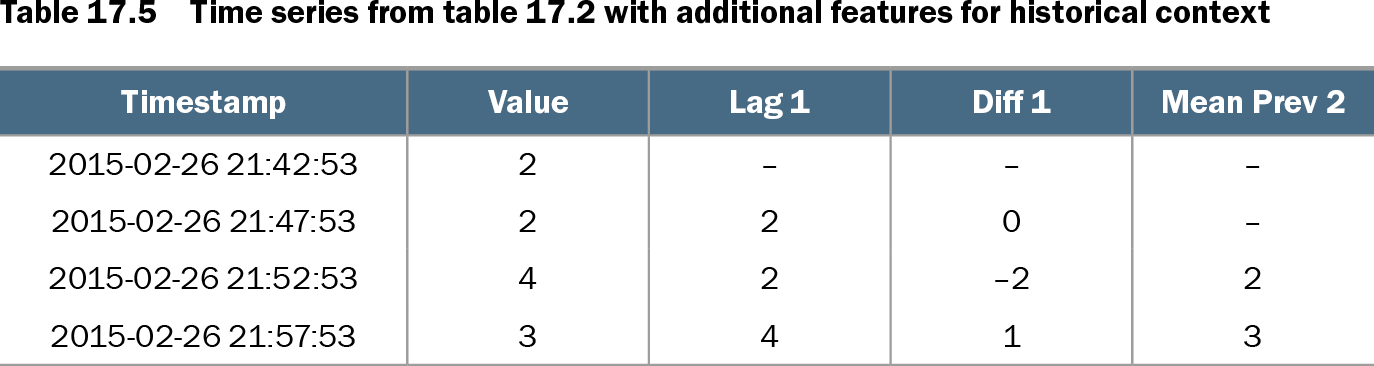
- Context-enriched records, where lag, difference, and historical-average features let each row represent a time-series value with relevant history. section 17.2.5
- Window tables, where each row represents a period and columns contain values within that period, enabling multivariate comparison. section 17.2.8
Social-media account summaries
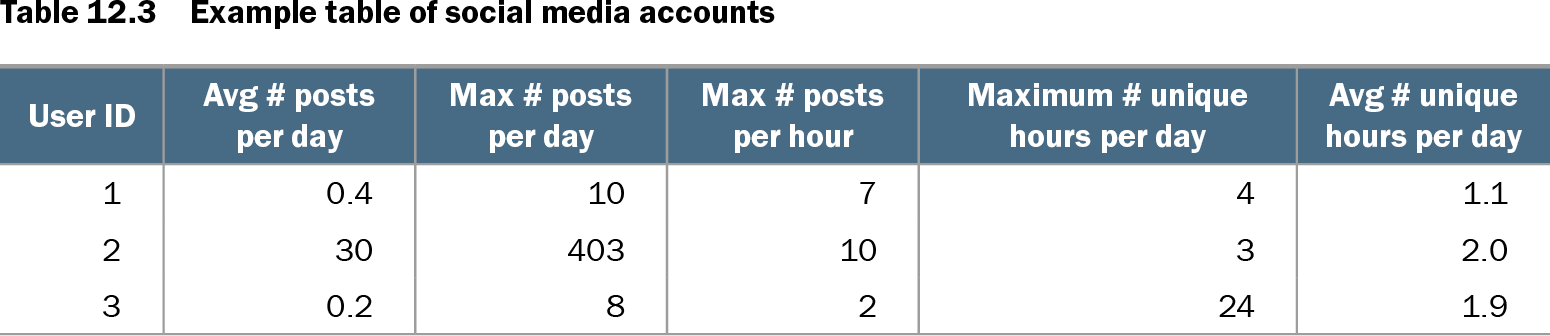
A user-activity table can include average posts per day, maximum posts per day, maximum posts per hour, and unique active hours. One account stands out with 403 posts in a day; another posts during at least 24 unique hours in a day. section 12.6
Table 12.3 Example table of social media accounts (view table figure)
| User ID |
Avg # posts per day |
Max # posts per day |
Max # posts per hour |
Maximum # unique hours per day |
Avg # unique hours per day |
|---|---|---|---|---|---|
| 1 |
0.4 |
10 |
7 |
4 |
1.1 |
| 2 |
30 |
403 |
10 |
3 |
2.0 |
| 3 |
0.2 |
8 |
2 |
24 |
1.9 |
Shows how raw user activity becomes one row per account with features designed to reveal unusual behavior. section 12.6
Table 17.5 Time series from table 17.2 with additional features for historical context (view table figure)
| Timestamp |
Value |
Lag 1 |
Diff 1 |
Mean Prev 2 |
|---|---|---|---|---|
| 2015-02-26 21:42:53 |
2 |
– |
– |
– |
| 2015-02-26 21:47:53 |
2 |
2 |
0 |
– |
| 2015-02-26 21:52:53 |
4 |
2 |
–2 |
2 |
| 2015-02-26 21:57:53 |
3 |
4 |
1 |
3 |
Shows how lag, difference, and previous-value means add temporal context while retaining a tabular representation. section 17.2.5