Structured data contains internal constraints, relationships, or spatial arrangements that make its values unsuitable for treatment as unrelated continuous numbers. A house’s story count must be a positive integer, image pixels occupy a grid, and molecular graphs contain nodes and edges. section 13.1 section 13.4
This structure matters when measuring similarity. A Gaussian-process kernel that compares raw numerical values can mistake visually or chemically different objects for similar ones, because those values may not be predictive features. Images are especially challenging when pixel values alone determine covariance. section 13.0 section 13.2
Common forms of structured data include:
- Images represented as matrices of pixels, such as 28-by-28 MNIST images with integer values from 0 to 255. section 13.1
- Molecular data represented as graphs whose nodes and edges encode chemicals and bindings. section 13.1
- Protein and other graph-structured data requiring features learned from the arrangement of their elements. section 13.3.2
MNIST as structured regression
Treating MNIST digit labels as continuous targets exposes the limitation of a regular Gaussian process: a model trained on 1,000 images and tested on 500 achieved a mean absolute error of about 2.7. A neural network feature extractor followed by a Gaussian process reduced the error to about 0.85 by learning a smoother, more useful representation. section 13.2.4 section 13.3.2
A practical solution is to place a neural network before the Gaussian process. The network converts structured inputs into continuous features; the GP then applies its mean and covariance functions to that learned representation. Scaling the extracted features to a small range helps avoid extreme values and produces a smoother representation for GP learning. section 13.3.2 section 13.4
Figure 13.4 Drug discovery as an example of a structured regression problem. Each compound is represented as a structured graph, and we aim to predict the effectiveness of the compound in treating some disease on a scale from 0 to 10.
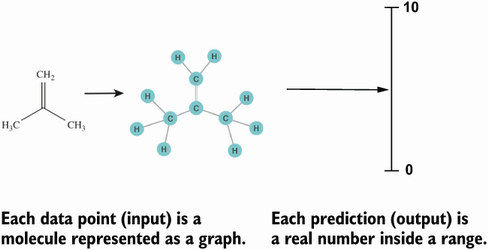
Visualize drug discovery as structured regression: represent each compound as a graph and predict its effectiveness on a continuous scale. section 13.1