A control chart plots a process metric over time against boundaries for its normal variation. For software delivery, it helps distinguish routine differences between work items from unusually slow or fast items worth investigating. That matters when one delayed ticket might otherwise distort a team’s view of its typical flow. section 9.2.1
Three lines guide the reading:
- The center line shows where the process normally runs, using an average or median. section 9.2.1
- The upper control limit marks the high end of normal variation. An item above it is a signal to investigate, not a reason to blame its owner. section 9.2.1
- The lower control limit marks the low end. An unusually fast item may reveal a useful pattern to repeat. section 9.2.1
Find the wait, not just the outlier
If a cycle-time point breaches the upper limit, break that item’s time into phases. An eight-day wait for review points to a different problem than eight days spent coding. Compare lead-time and cycle-time charts too: volatile lead time alongside stable cycle time suggests the waiting occurs before work starts. section 9.2.2
Figure 9.4 A lead time control chart. Ticket 9 breaches the upper control limit—that's a signal worth investigating, not a number to punish. The remaining tickets fall within the natural variation of the process.
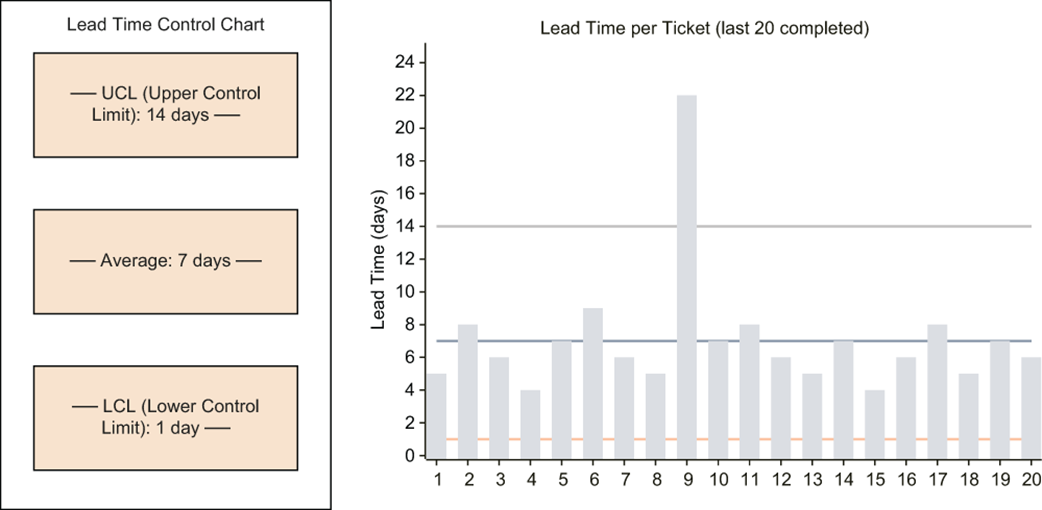
The lead-time chart shows one ticket above the upper control limit while the others remain within normal variation. section 9.2.1
Use a breach as a question: was the item blocked by a dependency, delayed in review, or poorly scoped? Avoid changing the process in response to every point inside the limits. The chart identifies where to look; investigating the work reveals what to change. section 9.2.1

