A counter is a metric whose value increases monotonically to represent a cumulative quantity, such as the total number of HTTP API invocations. section 5.3
Querying two points in time and subtracting the earlier value from the later one yields the number of events during that interval. A single point instead reports the cumulative total at that moment. section 5.3
Counting client errors
A time series such as mysvc_http_request_total{status_code="400"} records cumulative HTTP 400 responses. If its value rises from 12 to 24 between two query times, the service observed 12 client errors during that period. section 5.3
Use counters with dimensions that keep the number of resulting time series manageable:
- Represent bounded dimensions such as HTTP status codes, methods, or paths with labels. section 5.3 section 4.2.1
- Treat high-cardinality dimensions such as user IDs cautiously because each distinct combination creates another time series. section 5.3
- Remember that Prometheus supports counter types but does not enforce their semantics; naming conventions and relabeling help standardize instrumentation. section 4.2.1
Figure 5.2 Time series database concept, showing N time series of the mysvc_http_request_total metric
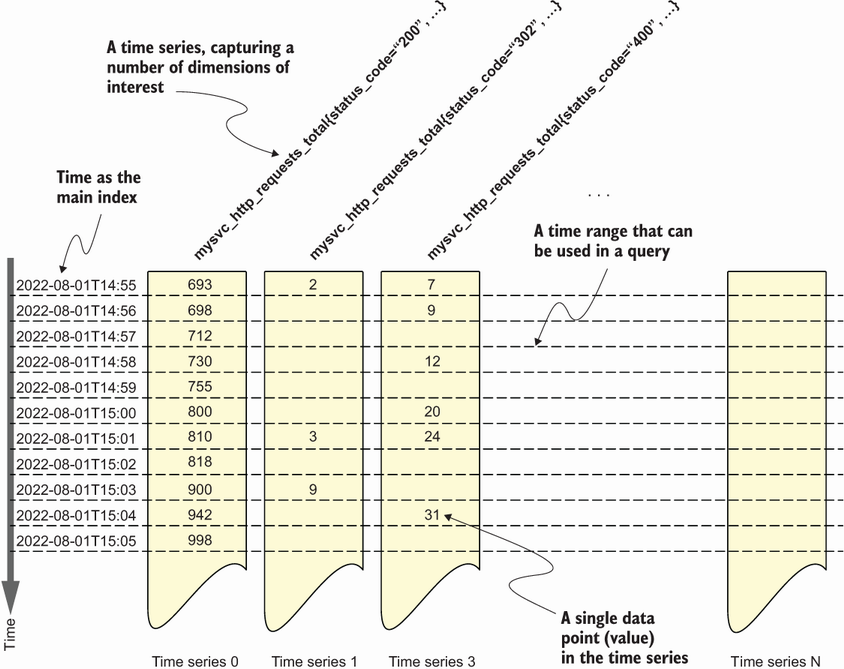
Use the time-series diagram to relate one counter metric, its labeled series, timestamps, and cumulative values. section 5.3



