Cyclicity detection checks how business measures change over time to reveal recurring patterns, periodic fluctuations, growth phases, stabilization, collapse, or rebound. It belongs in the first exploratory data analysis pass, alongside searching for outliers. The practical question is whether a change in performance reflects the business—or simply changing activity levels or market conditions. section 2.6.2
A practical workflow is:
- Plot date-related variables over time and inspect the shape rather than trusting a single summary metric. section 2.6.2
- Aggregate observations at a useful frequency, such as daily or monthly, before comparing periods. section 2.6.2
- Check whether apparent changes reflect volume shifts, score distributions, operational phases, or data-collection problems. section 2.6.2
Monthly review activity
Monthly review counts showed an almost inactive start, rapid growth, and later stabilization or collapse followed by rebound. Comparing metrics across those periods without checking this pattern could misattribute success to the project. section 2.6.2
Figure 2.3 The number of reviews over time—monthly aggregation
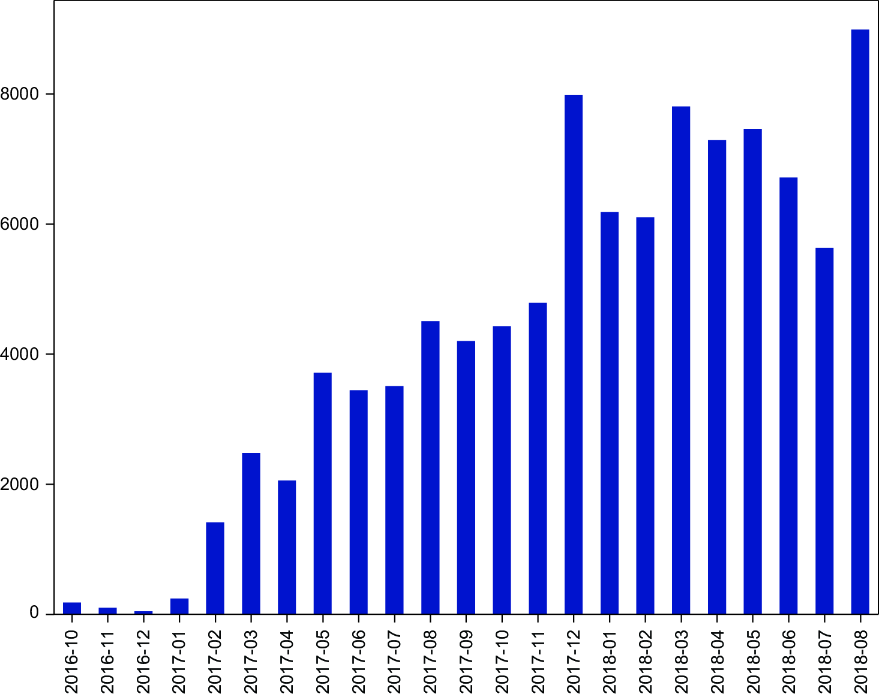
Use the monthly review-count figure to inspect temporal phases and possible fluctuations. section 2.6.2
