liveBook · Manning

DBSCAN

As explained in Grokking Machine Learning, Second Edition

DBSCAN is a density-based clustering algorithm that forms groups in dense regions and identifies isolated points as noise.

DBSCAN groups data points in dense regions and labels isolated points as noise. It offers a way to find clusters without assigning every point to a group. section 2.11

DBSCAN belongs to a family of clustering approaches:

  • K-means moves randomly chosen centers toward nearby points. section 2.11
  • Hierarchical clustering progressively joins nearby points. section 2.11
  • Gaussian mixture models assign fractional membership across clusters. section 2.11
Figure 2.5 A plot of the email dataset. The horizontal axis corresponds to the size of the email and the vertical axis to the number of recipients. We can see three well-defined clusters in this dataset.
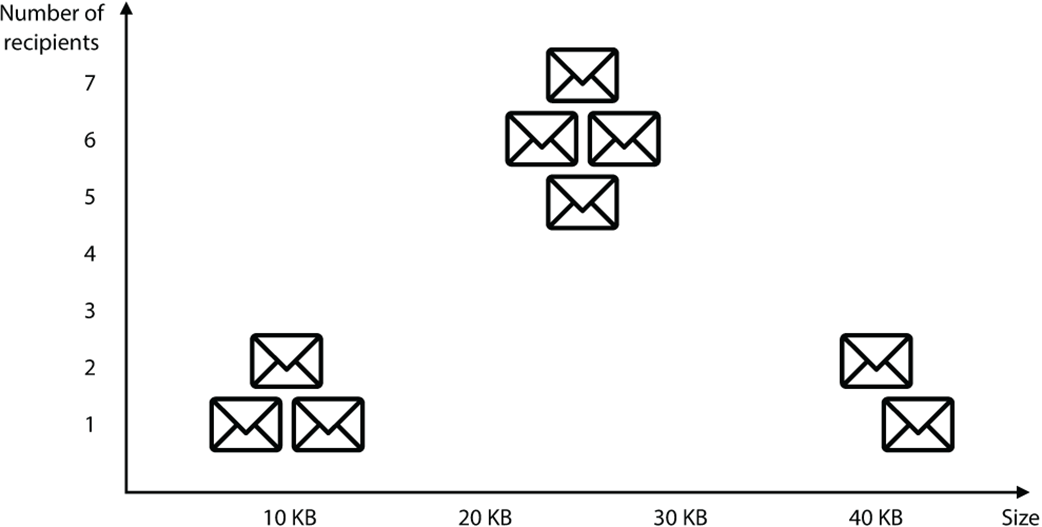
Inspect email size and recipient count as a concrete clustering dataset with three visible groups. section 2.11


How Grokking Machine Learning, Second Edition covers it

How deep it goes
Defines density-based grouping and noise labeling, but stops short of parameters, procedure, implementation, and worked output.
Examples
Uses an email dataset plotted by message size and recipient count, showing three visible clusters.
What it assumes
Assumes the basic idea of clustering data into similar groups and places DBSCAN within unsupervised learning.
What you can do after
Evaluate/understand how DBSCAN groups dense regions and treats isolated points as noise.
How it connects
Connects clustering with K-means, hierarchical clustering, and Gaussian mixture models.

Also explained in

Compare how 4 books explain DBSCAN →

Related concepts

This explainer was generated by Manning's knowledge graph from the text of Grokking Machine Learning, Second Edition. The section links point to the parts of the book it draws on.

