A dendrogram represents hierarchical clustering as a tree-like, stratified structure. Unlike a flat clustering, it preserves multiple partitioning levels, allowing you to inspect a selected section and recover the clustering associated with that level. section 12.4.4
Use the structure to reason about clustering choices:
- Read merges as increasingly broad clusters formed from smaller units. section 12.4.4
- Select a threshold or section to obtain a flat clustering at that level. section 12.4.4
- Apply different thresholds to different branches when one global threshold cannot preserve every desired separation. section 12.4.4
OPTICS clustering
For an example dataset, OPTICS uses ϵMAX=2.0 and minPoints=3 to produce a dendrogram. Clusters formed at ϵ=0.5 serve as basic units, while larger super-clusters represent later merges. section 12.4.4
Figure 12.23 The dendrogram built from the result produced by OPTICS, on our example dataset, with parameters ϵMAX=2.0 and minPoints=3. For the sake of clarity, we omit the bottom portion of the dendrogram for ϵ<0.5. Here we apply two different thresholds in two branches of the dendrogram.
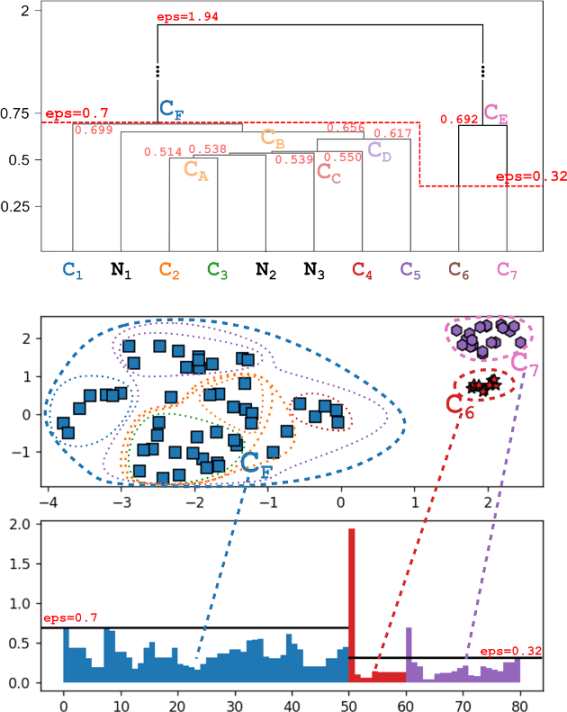
Inspect how two different thresholds are applied in separate dendrogram branches. section 12.4.4


