A dendrogram is a tree diagram showing how observations are iteratively grouped or merged by connectivity. Its branches expose nested clusters, with leaves representing terminal observations or groups. section 2.4
In hierarchical clustering, merge height represents the distance between clusters. Clusters joined at similar heights are more closely related than clusters joined farther apart. section 2.4.3
Use a dendrogram to choose a practical cluster count:
- Draw a horizontal cut across the dendrogram. section 2.4.3
- Count the vertical branches intersected by the cut; that count is the number of clusters. section 2.4.3
- Prefer a cut spanning the largest distance between successive merge heights, while checking that the resulting groups remain interpretable. section 2.4.3 section 2.4.4
Python workflow
Standardize the feature matrix, compute linkage with average, Ward, or complete methods, and plot the dendrogram with matplotlib. A truncated view of the last 10 merges can make the cut easier to inspect. Apply the selected distance with fcluster, count the resulting labels, and plot the groups. Different distance thresholds produce different cluster counts, so test several values. section 2.4.5
Figure 2.19 Dendrogram to identify the optimum number of clusters. The distance between X and Y is more than between A and B and between P and Q; hence, we choose that as the cut to create clusters and the number of clusters chosen is five. The x-axis represents the clusters, while the y-axis represents the distance (dissimilarity) between two clusters.
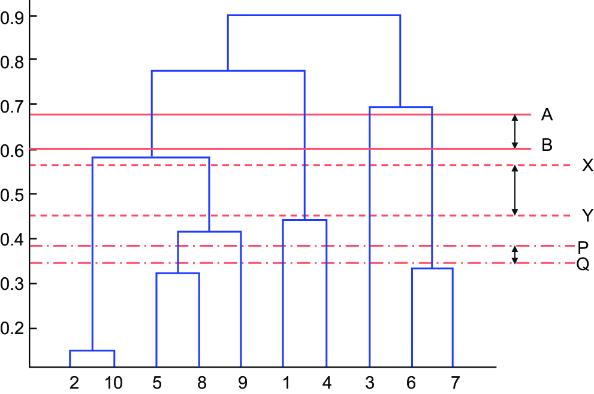
Use the dendrogram figure to compare candidate horizontal cuts and relate merge heights to dissimilarity. section 2.4.3


