liveBook · Manning

Dependency graph

As explained in Cloud Observability in Action

A service map is a graphical representation of the services in a distributed system and their communication relationships.

A dependency graph, also called a service map or call graph, shows services in a distributed system and the communication relationships between them. It provides a dynamic architectural overview and shows information flow, but not execution timing. section 2.5.3 section 8.1.1

Use the graph to:

  • Inspect how a request path connects services without manually correlating timestamped log events. section 2.5.3
  • Relate the architecture view to a trace, whose spans show each service invocation and whose waterfall view adds elapsed time. section 8.1.1
  • Treat the map as an operational starting point rather than a complete dependency inventory: external services may not appear as spans. section 8.2.3

Checkout request

A checkout request can connect checkout to the items data store, fraud detection, shipping, billing, a third-party payment provider, and inventory. The graph reveals the service relationships; the corresponding trace and waterfall reveal which invocation consumes the time. section 8.1.1
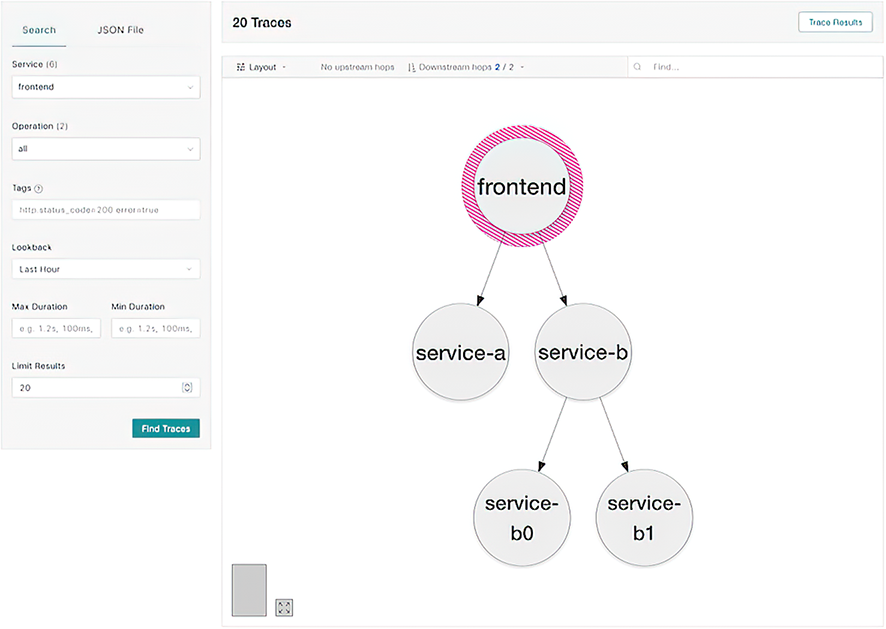
Figure 8.5 Troubleshooting demo microservices app: the happy path dependency graph

Open the happy-path dependency graph to inspect a dynamically generated application architecture before selecting an individual trace for temporal analysis. section 8.2.3

How Cloud Observability in Action covers it

How deep it goes
Explains graph purpose and limitations, then defers temporal behavior to traces, spans, and waterfall visualizations.
Examples
Uses an e-commerce checkout path and a Jaeger happy-path dependency graph to illustrate service relationships and investigation.
What it assumes
Assumes distributed-system and microservices context while defining traces, spans, and service maps at a high level.
What you can do after
Diagnose/debug with Jaeger by inspecting a dependency graph, selecting a trace, and switching to spans for timing details.
How it connects
Connects distributed tracing, microservices, traces, spans, waterfall visualization, context propagation, and observability frontends.

Also explained in

Compare how 5 books explain dependency graph →

Related concepts

This explainer was generated by Manning's knowledge graph from the text of Cloud Observability in Action. The section links point to the parts of the book it draws on.