A discrete variable contains separate, distinct values that can be identified individually. Its opposite, a continuous variable, can take any value along a spectrum. The distinction matters because different value structures support different visualization choices. section 3.4.1
Use the variable’s structure to guide the visual form:
- Treat integer identifiers and named categories as discrete values rather than as points on a connected scale. section 3.4.1
- Prefer bar charts for discrete dimensions, because separate bars preserve the separation between values. section 3.4.1 section 3.6
- Avoid connecting discrete categories with a line unless the values have a meaningful continuous interpretation; connected marks can imply relationships that are not present. section 3.4.1
- Check the time scale before labeling dates or times discrete: daily values may seem continuous across centuries, while hourly values may seem continuous across weeks. section 3.4.1
Fruit data
Fruit ID numbers are discrete integer values, while taste scores are continuous because they may be whole numbers or decimals. A bar chart compares the fruits cleanly; a line chart would falsely suggest that one fruit flows into the next. Plotting taste scores over time could make sense if enough data showed seasonal peaks. section 3.4.1
Figure 3.1 The fruit data shown as a line on the left just doesn’t work because the fruits aren’t continuous, nor could one approximate them as such. On the right, the viz works much better as a bar chart.
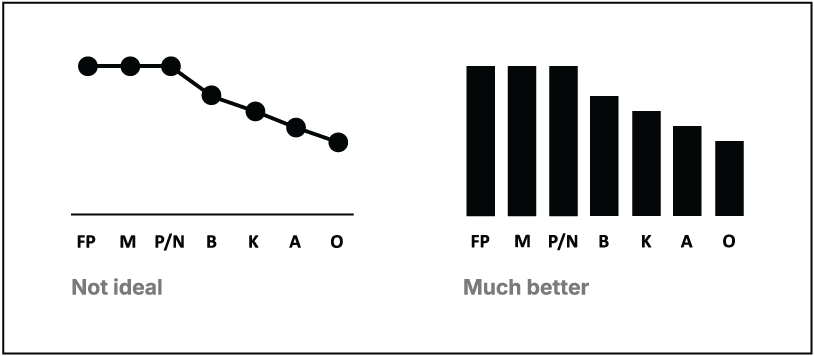
Compare the unsuccessful line treatment with the clearer bar-chart treatment for separate fruit values. section 3.4.1




