Data drift, or distribution mismatch, occurs when calibration data represents a different distribution from production inputs. In post-training quantization, the resulting activation ranges can make a model inaccurate even when the quantization algorithm itself is sound. section 4.2
Calibration runs inputs through the network to estimate activation ranges and derive quantization scale factors and zero-points. If the estimated range is too narrow, common production activations can be clipped; if it is too wide, quantization precision is wasted. Activation statistics depend on the inputs, so covering production traffic matters as much as the calibration algorithm. section 4.2 section 3.1
Detecting a coverage gap
A validation report compares layer 6's calibration maximum of 42.8 with a production maximum of 51.3. Coverage is 42.8 / 51.3 = 83.4%, leaving a 16.6% gap. The report flags the layer as critical; other layers passing does not remove that gap. section 4.2
Calibration Validation Report:
==========================================================================
Overall Status: FAIL ✗
Layers: 3 OK, 1 Warning, 1 Critical
Maximum Gap: 16.6%

Per-Layer Coverage:
--------------------------------------------------------------------------
Layer        |  Calib Max |   Prod Max |   Coverage | Status
--------------------------------------------------------------------------
layer_6      |       42.8 |       51.3 |      83.4% | CRITICAL ✗
layer_0      |       25.4 |       28.1 |      90.4% | WARNING ⚠
layer_3      |       32.1 |       31.5 |     101.9% | OK ✓
layer_9      |       38.2 |       36.8 |     103.8% | OK ✓
layer_11     |       38.5 |       36.2 |     106.4% | OK ✓
==========================================================================
Inspect the per-layer maxima and coverage statuses in the failed validation report. section 4.2
Build and check calibration coverage against production:
- Source production logs or traffic samples, then stratify across user segments and important edge cases. Include temporal variation where traffic differs by time of day. section 4.2
- Cover input conditions that change activations: for example, lighting and contrast for images, or prompt length, code, and reasoning for language models. section 4.2
- Compare calibration and production activation ranges by layer. If coverage gaps appear, revise the sample and validate again. section 4.2
Figure 4.3 Workflow for preparing a calibration set. The process flows from top to bottom: source production data from logs or traffic samples, apply stratified sampling to cover user segments and edge cases, validate distribution coverage against known activation patterns, and iterate if coverage gaps are found. Each stage includes a quality gate that prevents poorly representative data from reaching calibration.
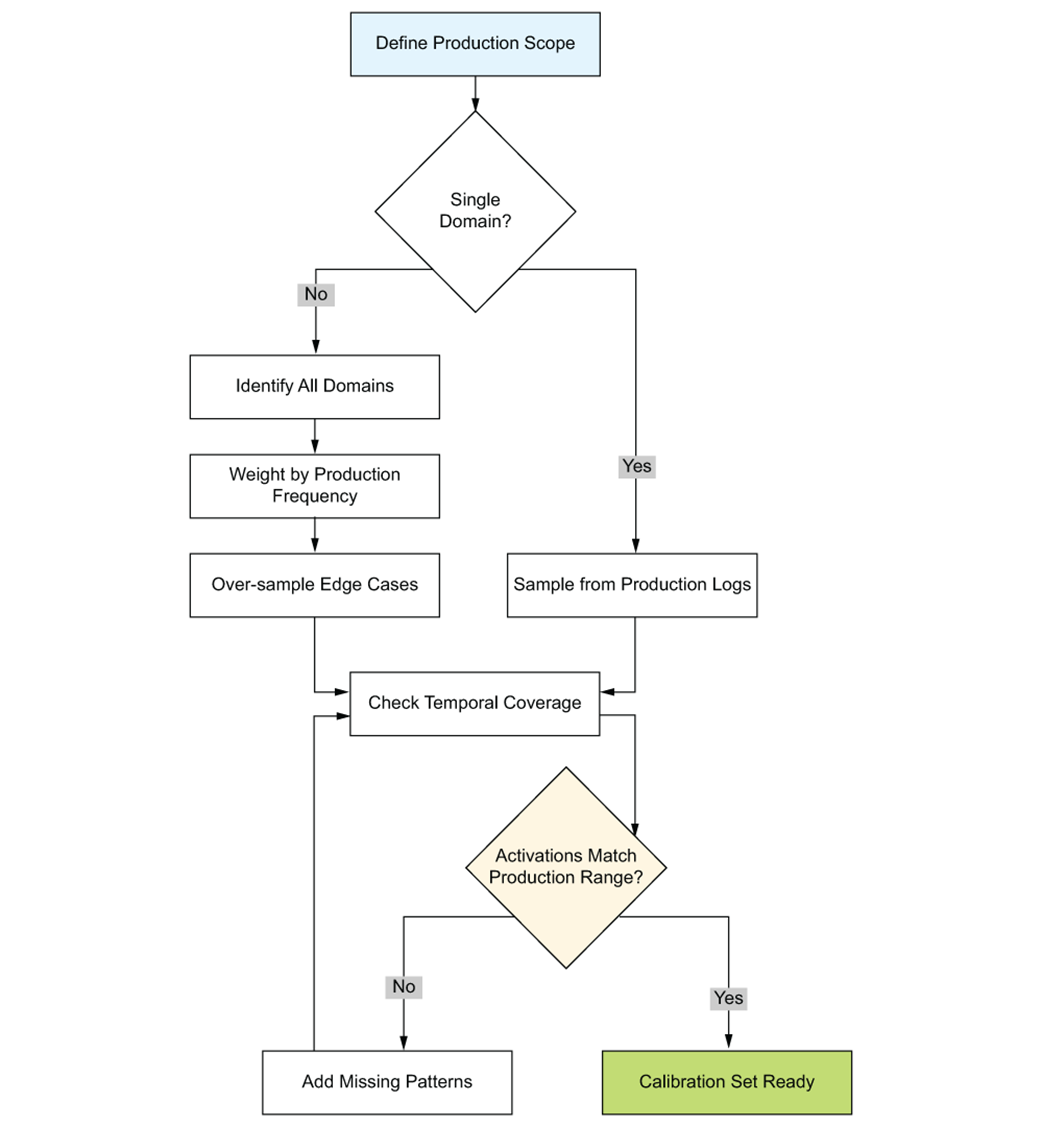
Follow the sampling and validation workflow, including its quality gates. section 4.2