A double top is a chart pattern in which an uptrend forms two successive peaks before a sustained decline. It can signal a bearish reversal, but the pattern remains a historical template rather than a guarantee. section 10.1.2 section 10.4
Read the pattern as a sequence:
- An uptrend attracts optimistic buyers and may reflect extreme greed. section 10.1.2
- Selling produces the first peak; renewed buying creates a second peak. section 10.1.2
- After the second reversal, the decline continues, suggesting a shift toward a downtrend. section 10.1.2
Figure 10.10 The bearish double top is a pattern that, after an uptrend, has two peaks before it goes down again. If traders identify this pattern in time, they can sell or buy accordingly.
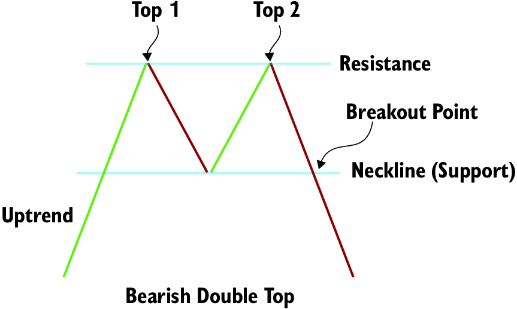
Use the figure to compare the initial uptrend, two peaks, and subsequent decline. section 10.1.2
