A reversal pattern is a chart formation interpreted as a possible change in an existing price trend. It follows one trend before moving into its opposite direction, but the pattern remains a template rather than a prediction. section 10.1.2 section 10.4
Use reversal patterns as reference points, not guarantees:
- A bearish double top begins with an uptrend, forms two peaks, and may precede a downtrend. section 10.1.2
- A bullish form reverses a downtrend toward an uptrend; patterns can therefore have bearish and bullish versions. section 10.1.2
- Related examples include head-and-shoulders, rising wedge, expanding triangle, triple top, and pennant patterns. section 10.1.2
- Analysts may combine pattern interpretation with support, resistance, and breakout levels, while recognizing that traders frequently misjudge movements. section 10.1.2
Figure 10.10 The bearish double top is a pattern that, after an uptrend, has two peaks before it goes down again. If traders identify this pattern in time, they can sell or buy accordingly.
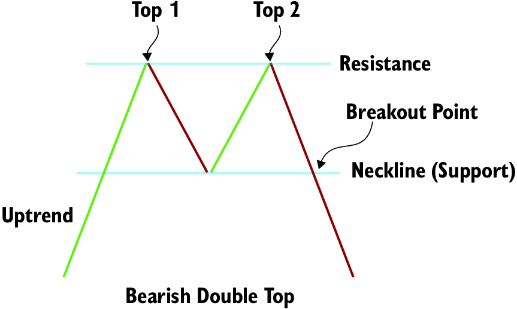
Compare the two-peak bearish double top with its possible price decline after an uptrend. section 10.1.2
