DoubleML is an open-source R and Python library for estimating causal effects with double machine learning and related methods. It is useful when flexible machine-learning models are needed for nonlinear relationships and when estimate precision and reliability matter, such as in healthcare or finance. section 8.0 section 8.6
Rather than treating predictive accuracy as causal evidence, use the library after identifying confounders to adjust for. Its methods assume that relevant confounders have been measured or selected carefully, for example with the back-door criterion. section 8.6 section 8.0
Key interfaces and methods include:
- DoubleMLPLR, the partially linear regression estimator, takes ml_m to predict treatment from confounders and ml_l to predict outcome from confounders. Despite its name, PLR supports regression and classification problems. section 8.1.3
- Confidence intervals can be calculated analytically after fitting a DoubleML estimator and accessed through its summary output. section 8.2.2
- Interactive regression models (IRM) provide the library’s implementation of augmented inverse probability weighting (AIPW) for binary treatments. section 8.3.1
- DoubleMLDID applies difference-in-differences with covariates and machine-learning models, including nonlinear relationships. section 11.4.5
Estimating a 401(k) effect
A practical PLR analysis estimates the causal effect of enrolling in a 401(k) plan on net financial assets. Different machine-learning models can be paired with the estimator to model treatment and outcome relationships with confounders. section 8.1.3
Difference-in-differences with an age covariate
For an ATET question over time, create DoubleMLData with outcome, treatment, age covariate, and time columns; then fit DoubleMLDID using a regression outcome learner and logistic treatment learner. section 11.4.5
Two-fold cross-fitting applied to the DML algorithm. Once the process is finished, you must switch roles between datasets 1 and 2. This process can be generalized to k-fold cross-fitting by breaking the data into k datasets instead of two.
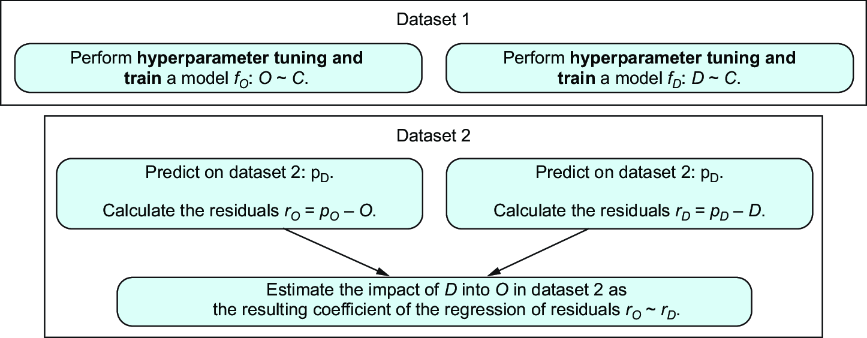
Use the diagram to see two-fold cross-fitting: train and estimate on alternating dataset roles, then generalize the procedure to k folds. section 8.1.3
