An effect size describes how large a difference is, rather than merely whether a statistical test detects one. For a comparison of group means, Cohen’s d is one option. Unlike a significance result, an effect-size calculation is not driven by sample size. section 4.2.1
This distinction matters when datasets contain thousands or millions of records: nearly identical means can produce a statistically significant result. Before recommending action, set a minimum difference that matters in the domain. A 0.5% difference in student test scores may be unimportant, while the revenue from a 0.2% increase in conversion rate may justify attention. A confidence interval can help compare the estimated mean difference with that threshold. section 4.2.1
Keep two uses of effect size separate:
- When interpreting results, use a measure such as Cohen’s d alongside significance testing and a domain-specific threshold; a low p-value alone does not establish a useful difference. section 4.2.1
- Before collecting or testing data, specify an effect size to detect in a power analysis. A t-test exercise uses an assumed medium effect of 0.5 and 80% power to estimate the required sample size at different alpha levels. The assumed effect is a planning input, not an observed result. section 4.2.2
Figure 4.26 Increasing the sample size by a factor of 10 yields a statistically significant result.
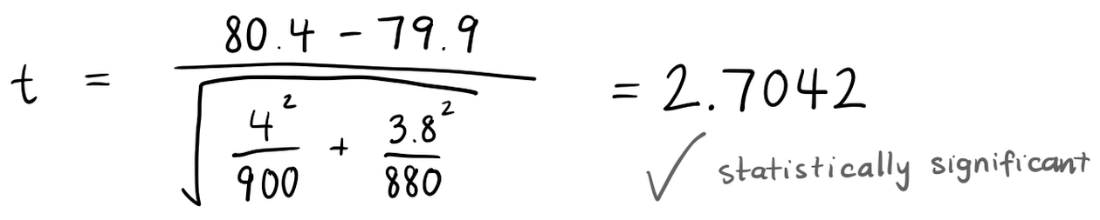
A tenfold increase in sample size makes the illustrated comparison statistically significant. Use the figure to see why significance alone cannot establish that the difference is large enough to matter. section 4.2.1
from statsmodels.stats.power import TTestIndPower     #1

pwr = TTestIndPower()     #2
sample = pwr.solve_power(effect_size = 0.5,
     power = 0.8,
     alpha = 0.05)
print(sample)
This Python listing supplies an assumed effect size, power, and alpha level to statsmodels to calculate a recommended sample size for an independent-samples t-test. section 4.2.2

