Effect size measures how large a difference or relationship is, not whether it merely clears a significance threshold. It adds practical meaning to a significance test: a result can be statistically significant yet negligible in magnitude, or statistically insignificant yet comparatively large when few records are available. section 7.4.3 section 20.3
For two continuous groups, Cohen’s d standardizes the difference between their means by their average, pooled standard deviation. The resulting d estimate describes how many standard deviations separate the means; its sign depends on the order of the inputs, while its distance from zero indicates magnitude. section 13.8.3 section 12.7.3
Choose an effect-size test to match the data and companion significance test:
- Use Cohen’s d, Hedges’ g, or Glass’s delta with continuous data alongside a t-test. section 20.3
- Use Cramer’s V with categorical data alongside a chi-square test for independence. section 9.0
- Use Hedges’ g when working with few records; use Glass’s delta when choosing one group’s standard deviation as the denominator matters. section 13.11
Home versus road officiating
Comparing NBA personal fouls per game, Cohen’s d was 0.089 in the 2018–19 regular season and 0.158 in the 2019 playoffs—both negligible. The postseason t-test was not significant, illustrating why magnitude and significance answer different questions. section 7.4.3 section 7.4.2
Read effect size beside, never instead of, a significance test. Significance testing uses record counts to assess a null hypothesis; effect-size testing does not. Do not reject or fail to reject a null hypothesis from an effect size alone. section 12.10 section 20.3
Figure 20.3 Effect size tests should complement or supplement, and not replace, significance testing. Cohen’s d, Hedges’ g, and Glass’s delta are effect size tests that were run to complement t-tests, where the data is continuous; Cramer’s V is an effect size test that was run to complement a chi-square test for independence, where the data is categorical rather than continuous. A Cohen’s d test, the most popular effect size test for continuous data, was run from the effsize package in chapters 7, 12, and 13 and from the effectsize package in chapter 13; Hedges’ g and Glass’s delta tests were run from the effectsize package in chapter 13 only. Cramer’s V was run twice in chapter 9, once from the questionr package and once from the rcompanion package.
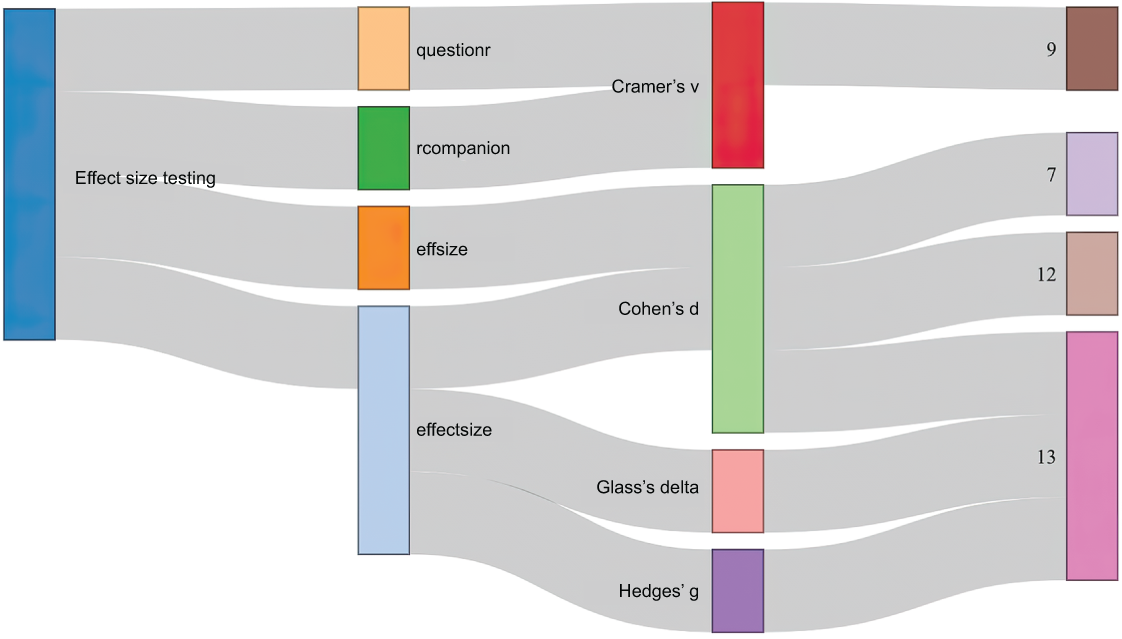
Use this map to connect continuous and categorical data types to their effect-size tests, companion significance tests, and R packages. section 20.3

