An eigenvalue measures how much variance a corresponding eigenvector captures when PCA analyzes the covariance matrix of standardized molecular data. Larger eigenvalues identify directions carrying more information. section 6.2.3
Use eigenvalues in PCA to:
- Rank eigenvectors: the largest eigenvalue determines PC1, followed by PC2 and later components. section 6.2.3
- Choose the retained dimensionality: apply an eigenvalue threshold, retain enough components for a target proportion of variance, or inspect a scree plot. section 6.2.3
- Compress a molecular dataset by retaining the first k principal components and representing each sample in the new coordinate system. section 6.2.3
Figure 6.9 PCA defines a new coordinate system based on principal components, where the important dimensions are self-evident, and we can reduce the data dimensionality to k by retaining the first k PCs as ranked by the amount of variance they explain.
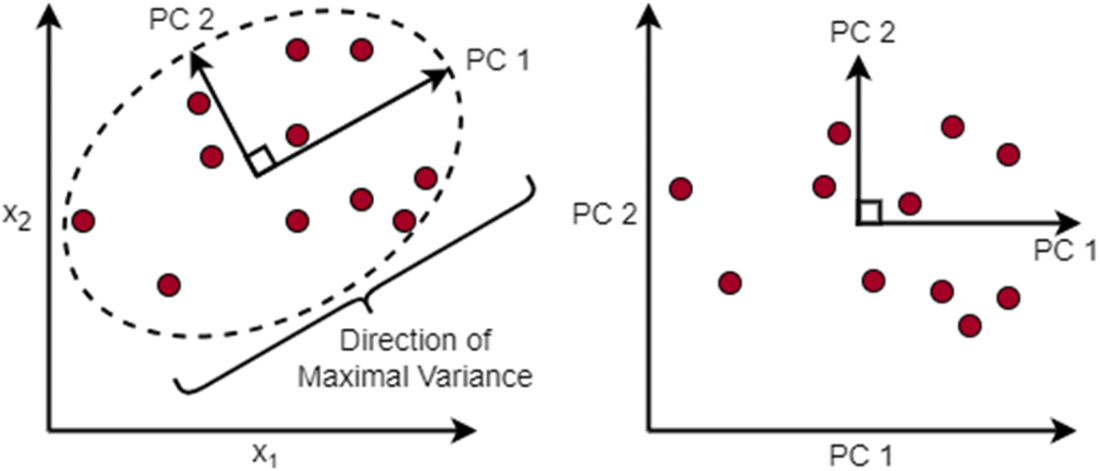
Visualize how PCA ranks new coordinate directions by the variance their eigenvalues explain, making the retained dimensions evident. section 6.2.3