The elbow method selects a hyper-parameter where additional model complexity produces sharply diminishing improvement. In clustering, plot an evaluation metric for several parameter values and choose the bend in the curve. section 12.5
A practical clustering workflow is:
- Choose an evaluation metric suited to the algorithm, such as intra-cluster average distance; centroid distance is specific to centroid-based methods, whereas intra-cluster distance also supports DBSCAN and OPTICS. section 12.5
- Test a sequence of parameter values and plot the best metric value for each one. For randomized k-means, run the algorithm several times per value and retain the best result. section 12.5
- Select the value at the curve’s elbow, where improvement changes substantially; after that point, added centroids improve the metric very little. section 12.5
- Inspect neighboring clusterings rather than relying on the plot alone: too few centroids can merge natural groups, while too many can split them. section 12.5.1
Choosing the number of customer clusters
For a scaled customer dataset, evaluate k-means across candidate values of k using intra-cluster average distance. The curve identifies k=6: k=5 leaves natural groups combined, while k=7 splits one natural group across two centroids. section 12.5 section 12.5.1
Figure 12.25 The elbow method used to determine the best value for the number of clusters into which the dataset in figure 12.24 should be split. You can guess where the name comes from.
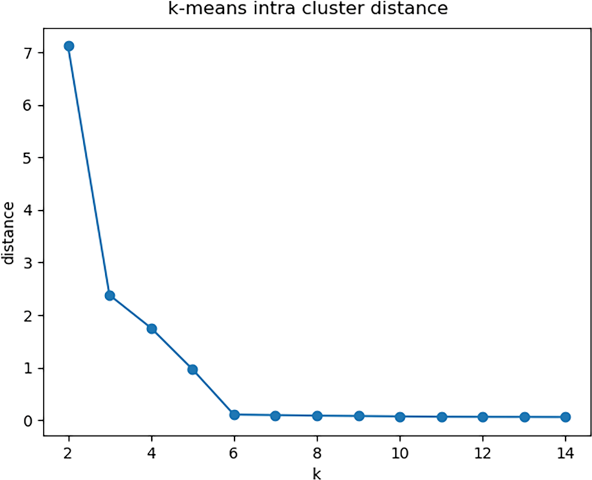
Use the elbow plot to see how the selected parameter corresponds to the curve’s visible bend. section 12.5




