The empirical rule quickly estimates what is typical or extreme when data follows a normal, bell-shaped distribution. Starting with the mean, count outward in standard deviations. section 4.7
For normally distributed data, the approximate coverage is:
- About 68% lies within 1 standard deviation of the mean. section 4.7
- About 95% lies within 2 standard deviations of the mean. section 4.7
- About 99.7% lies within 3 standard deviations of the mean. section 4.7
A perfect coffee measurement
Suppose the mean measurement is 27.6 grams and the standard deviation is 3.2 grams. The rule gives ranges of 24.4–30.8 grams for 68%, 21.2–34.0 grams for 95%, and 18.0–37.2 grams for 99.7%. These are estimates only when the measurements follow a normal distribution. section 4.7
Figure 4.10 The empirical rule of the standard deviation
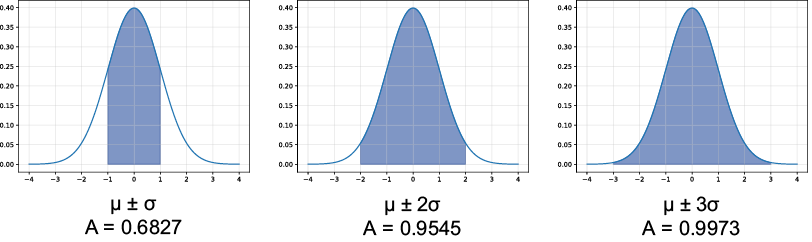
Use the normal-curve figure to see how expanding one, two, and three standard deviations captures increasingly large areas. section 4.7
mu, sigma = 27.6, 3.2

min68, max68 = mu-sigma*1, mu+sigma*1
print(f"68% of baristas report coffee measurement between {min68:.1f} and {max68:.1f} grams")

min95, max95 = mu-sigma*2, mu+sigma*2
print(f"95% of baristas report coffee measurement between {min95:.1f} and {max95:.1f} grams")

min99_7, max99_7  = mu-sigma*3, mu+sigma*3
print(f"99.7% of baristas report coffee measurement between {min99_7:.1f} and {max99_7:.1f} grams")

# 68% of baristas report coffee measurement between 24.4 and 30.8 grams
# 95% of baristas report coffee measurement between 21.2 and 34.0 grams
# 99.7% of baristas report coffee measurement between 18.0 and 37.2 grams
Use the Python listing to calculate the three ranges from a mean and standard deviation. section 4.7
