liveBook · Manning

Enclosure

As explained in Everyday Data Visualization

A visual grouping technique in which a boundary or contained area signals that its contents belong together and are more related to one another than to elements outside it.

Enclosure groups elements by placing them inside the same bounded space. A box, panel, or contained area quietly tells the eye, “These belong together,” separating its contents from everything outside. section 2.2.1

Use enclosure to make relationships visible at a glance:

  • Surround related data points or visual elements with a boundary so their shared membership is immediately legible. section 2.2.1
  • Treat surrounding space as an active design choice: a lighter background can enclose and emphasize foreground information. section 8.4.3

From storage boxes to dashboards

Clear containers on shelves make household items appear organized and related. The same visual cue works in data visualization: a box around several elements says they are more related to one another than to elements outside the box. section 2.2.1
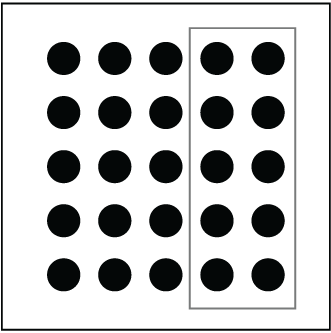
Figure 2.7 Principle of enclosure
02-07

Figure 2.7 provides a direct visual demonstration of how enclosing elements in a box creates a perceived group. section 2.2.1

How Everyday Data Visualization covers it

How deep it goes
Defines enclosure perceptually and applies it to data visualization without detailing implementation methods.
Examples
Uses boxes, clear containers, and a dashboard background surrounding foreground information.
What you can do after
Apply enclosure by surrounding related visualization elements with a boundary or contrasting background.
How it connects
Connects enclosure with proximity, similarity, symmetry, connection, closure, continuity, and figure/ground.

Related concepts

This explainer was generated by Manning's knowledge graph from the text of Everyday Data Visualization. The section links point to the parts of the book it draws on.