A Gestalt principle describes how perception organizes many parts into a unified whole, helping the brain recognize patterns and simplify visual complexity. In design and data visualization, these principles make relationships easier to see without requiring every element to be inspected individually. section 2.2
Use these perceptual relationships to organize visual information:
- Enclosure and proximity group elements that appear correlated. section 2.3
- Similarity makes objects with shared shapes or appearances feel like members of the same group. section 2.3
- Symmetry establishes repetition through reflectional, rotational, or translational patterns. section 2.3
- Connection signals relationships between elements, while closure and continuity encourage the eye to complete gaps in open or closed paths. section 2.3
Making a chart’s point visible
A chart can announce its message in the title, communicate it visually through trends and Gestalt grouping, then reinforce it with labels, annotations, and callouts. For a multiline chart, decluttering or using small multiples can make relationships easier to follow than leaving every line tangled together. section 6.1.5 section 6.4
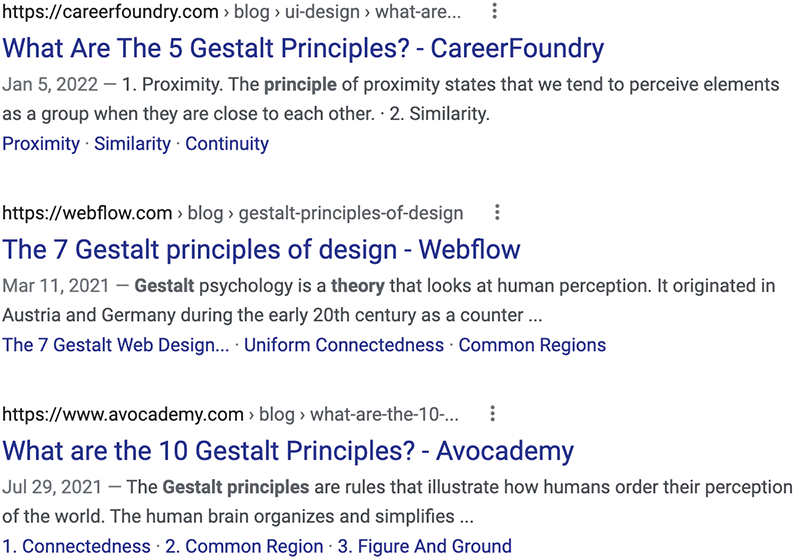
Use the search-results figure as a reminder that Gestalt principles do not form one universally agreed, exhaustive list. section 2.2
