Suppose a medical classifier labels 990 healthy people as healthy but misses all 10 sick people. Its accuracy is 99%, yet it fails at finding the people who need attention. An F-score helps evaluate a classifier by combining two questions: How many actual positives did it find, and how many of its positive predictions were right? section 7.2 section 7.4
Call a correctly predicted positive a true positive (TP), a missed positive a false negative (FN), and an incorrectly predicted positive a false positive (FP). Recall is TP / (TP + FN): the share of actual positives found. Precision is TP / (TP + FP): the share of positive predictions that were right. section 7.2 section 13.4
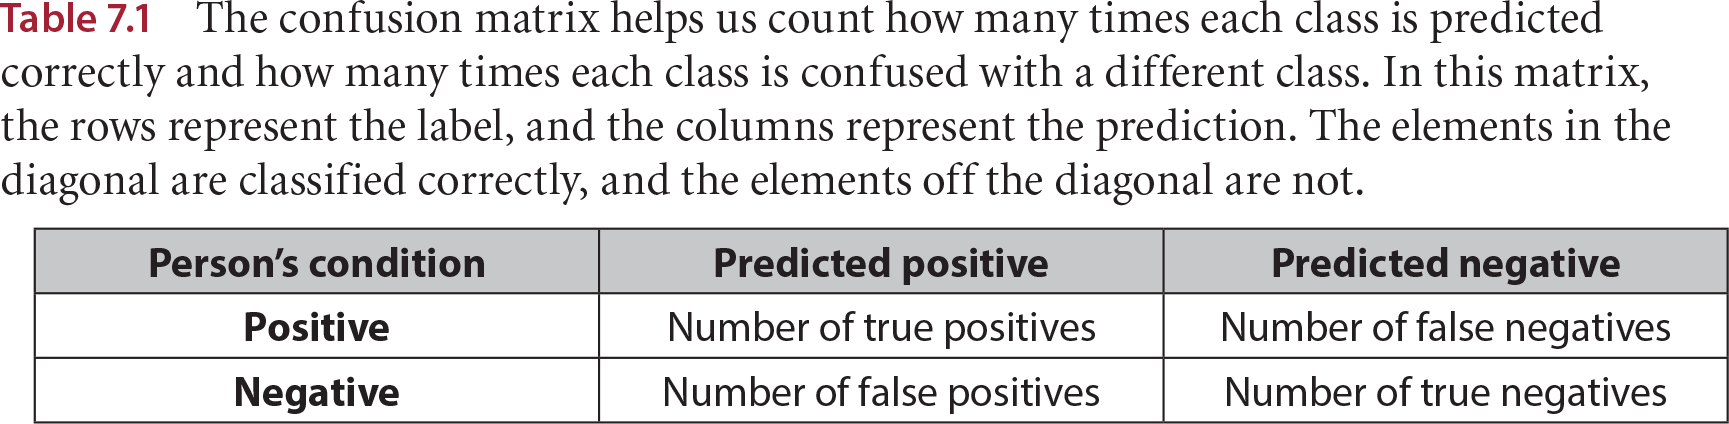
Table 7.1 The confusion matrix helps us count how many times each class is predicted correctly and how many times each class is confused with a different class. In this matrix, the rows represent the label, and the columns represent the prediction. The elements in the diagonal are classified correctly, and the elements off the diagonal are not. (view table figure)
| Person’s condition |
Predicted positive |
Predicted negative |
| Positive |
Number of true positives |
Number of false negatives |
| Negative |
Number of false positives |
Number of true negatives |
Use the confusion matrix to locate true positives, false positives, and false negatives before calculating precision and recall. section 7.2
The F1-score combines precision and recall using their harmonic mean: F1 = 2 × precision × recall / (precision + recall). It lies between the two values but closer to the smaller one, so a high score calls for both strong precision and strong recall. section 7.4 section 13.4
Compare two spam filters
One filter correctly flags 30 spam emails, misses 10, and wrongly flags 5 ordinary emails. Its precision is 30/35, recall is 30/40, and F1-score is 0.80. A second filter has 35 true positives, 5 false negatives, and 10 false positives: its F1-score is 70/85, about 0.82. The second filter scores slightly higher, though it wrongly flags more ordinary emails. section 7.2
When one kind of mistake matters more, look beyond F1. The Fβ-score lets you give recall more importance with a higher β, or precision more importance with a lower β, while still considering both. For hands-on evaluation, predict validation labels and pass them with the true labels to Scikit-Learn’s f1_score function. Try the same calculation for an animal-video recommendation model, then decide whether its score reflects a useful recommender. section 7.4 section 13.4 section 7.5