Fuzzy c-means (FCM) groups observations while preserving partial membership. A customer transaction, for example, can belong to several clusters to different degrees rather than receiving one absolute label. section 5.5.1
FCM resembles k-means but assigns each point a membership grade for every cluster. Grades range from 0 to 1, indicate degree of belonging, and should not be interpreted as probabilities or assumed to sum to 1. section 5.5.1
A practical FCM workflow includes:
- Prepare the data points and choose candidate numbers of clusters. section 5.5.2
- Set cluster centers, weights, a random seed, an error tolerance, and a maximum iteration count. section 5.5.2
- Run `fuzz.cluster.cmeans`, collect membership values and centers, and compare the resulting configurations using the fuzzy partition coefficient (FPC). section 5.5.2
- Plot points and mark centers, using the strongest membership with `argmax` for a readable assigned-cluster view. section 5.5.2
Synthetic two-dimensional data
Generate 500-point groups from specified centers and standard deviations, then evaluate FCM with different cluster counts. Plot each configuration, mark its learned centers, and display its FPC to compare outputs. section 5.5.2
Figure 5.17 Data points that can be clustered (left). The data points can be grouped into two clusters. For the first cluster, the cluster centroid is represented using a + sign (middle). Point 1 is much closer to the cluster center as compared to point 2. So we can conclude that point 1 belongs to this cluster to a higher degree than cluster 2.
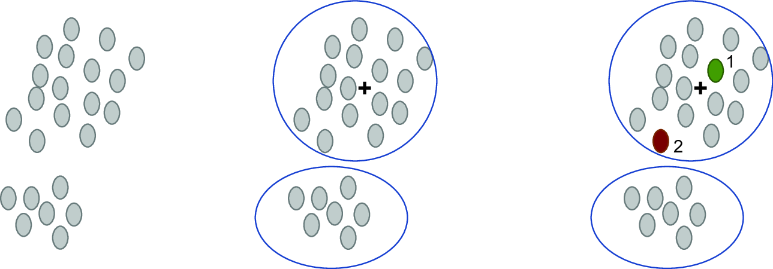
Use the diagram to see how distance from a centroid changes a point's membership degree: a nearer point belongs more strongly than a boundary point. section 5.5.1
