A Gaussian mixture model (GMM) is a soft clustering method for data whose groups may overlap. Instead of locating clusters by centroids alone, it fits several Gaussian distributions and assigns each data point a probability of belonging to each one. section 5.6.1 section 5.9
A Gaussian distribution has a mean that locates its center and a variance that affects its shape. For multidimensional data, the mean becomes a vector and the covariance matrix describes variation and relationships among inputs. A GMM fits a mean, covariance, and weight for each distribution; unlike k-means, it uses more than the mean. section 5.6 section 5.6.1
Figure 5.20 A Gaussian distribution is one of the most famous distributions. Observe how the values of mean and standard deviation are changed and their effect on the corresponding curve.
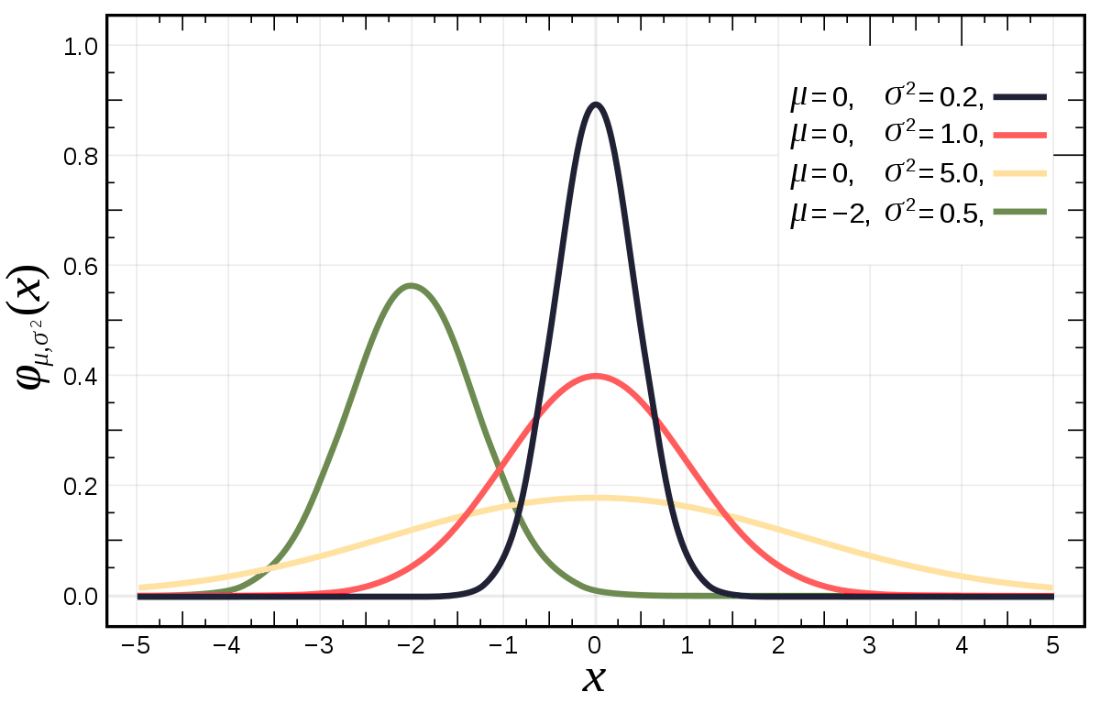
Compare the curves to see how changing a Gaussian distribution’s mean and standard deviation changes its position and shape. section 5.6
Expectation–maximization (EM) estimates the mixture parameters iteratively:
- Start with current estimates of the distributions and their parameters. section 5.6.1
- Estimate each point’s probability of belonging to each distribution. section 5.6.1
- Update the model parameters using those estimates, then repeat until the values fit the data well enough. section 5.6.1
An overlapping point
Suppose a point could have been generated by either of two Gaussian distributions. A single definite label hides that uncertainty; GMM estimates its probability of belonging to each cluster. This makes it useful when groups overlap. section 5.6.1 section 5.9


