A Gaussian mixture model (GMM) represents data with several multivariate Gaussian components rather than one. Each component has a center and a shape determined by feature variances and correlations. Its weight reflects how much data that component generates. This makes a GMM useful when records form multiple clusters with different shapes or densities. section 5.6
For outlier detection, the components provide a probability-density estimate. A point near a well-represented component is generally more probable than one far from every component; overlap between components can also increase its estimated probability. With a single cluster, this resembles the covariance and Mahalanobis-distance approach of an Elliptic Envelope. Multiple components let the model account for distinct clusters instead of treating them as one ellipse. section 5.6
Figure 5.8 Data with three clusters, each captured by a multivariate Gaussian. Each location in the space has a probability, which can be estimated by the sum of the probabilities of it being generated by any one of the Gaussians, weighted by the size of each Gaussian.
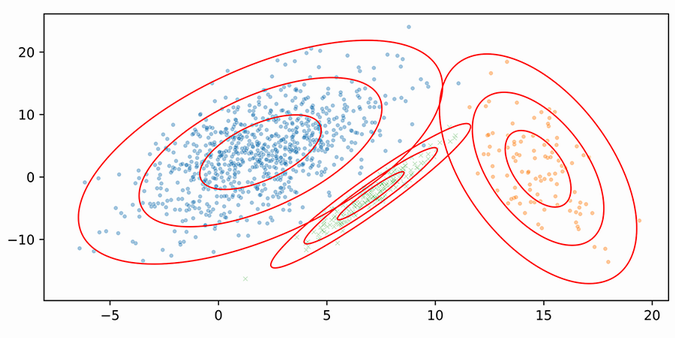
The three-cluster diagram shows how component probabilities, weighted by component size, contribute to the probability at a location. section 5.6
Two practical ways to use a fitted GMM are:
- Score records against the modeled clusters. One cluster-based approach first removes strong outliers with Isolation Forest, selects a component count using the Bayesian information criterion (BIC), then scores distances relative to each cluster; it can also give small clusters extra weight. section 7.8.1
- Generate synthetic records. Sample a component according to its weight, then sample from that component’s Gaussian. The result tends to resemble typical data; changing component means or covariances can produce less typical test data. section 11.2.3
Three clusters and synthetic baseball data
A two-feature example combines 500 points in three compact clusters with 15 broadly scattered points to examine outlier detection. In a separate baseball-data example, GMM samples preserve feature associations but tend to produce clean, typical records. Expanding the fitted covariance matrices spreads generated records over a much wider range. Neither a low-probability score nor an altered synthetic record establishes that a real-world event is meaningful; use such results to investigate and test detectors. section 5.6 section 11.2.3 section 11.6
GMMs also perform soft clustering: a record receives a score for how well it matches each cluster, rather than only a hard cluster assignment. Their usefulness depends on how well those Gaussian components represent the data. As with other outlier detectors, compare approaches rather than expecting one model to find every kind of outlier. section 5.6 section 5.0


