Gini impurity measures how mixed the labels are in a group of samples. A group with one label throughout has impurity 0; a group containing several labels has a higher value. Decision trees use this idea to favor questions that leave the resulting groups as pure as possible. section 9.18 section 9.4
Imagine drawing two balls from a box, allowing the same ball to be drawn twice. The Gini impurity is the probability that the two draws have different colors. A box with eight balls of one color and two of another has Gini impurity 1 − 0.8² − 0.2² = 0.32. For class proportions p₁ through pₙ, the formula is Gini = 1 − p₁² − p₂² − … − pₙ². section 9.3
Figure 9.10 Summary of the calculation of the Gini impurity index
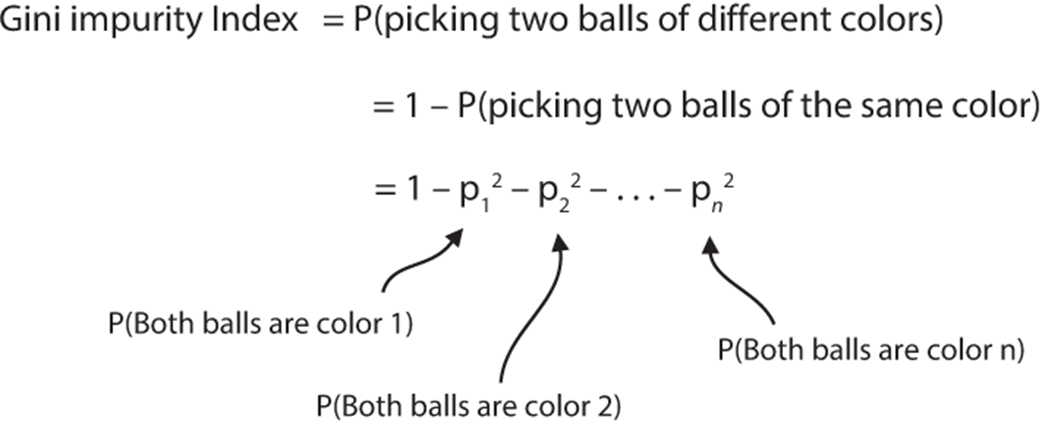
Use the calculation diagram to connect class proportions with the probability of drawing two differently labeled samples. section 9.3
Choosing a better question
For an app-recommendation dataset, splitting users by platform leaves two groups with average Gini impurity 0.444. Splitting by age produces one pure group and one mixed group, for average impurity 0.222. Because lower impurity means purer branches, age is the better first question. section 9.3
To score a split, calculate the impurity in each branch and combine the results as an average. When branches have different numbers of samples, weight each branch by its share of the original group. For numeric features, compare the possible thresholds and select the one with the lowest weighted Gini impurity. section 9.3 section 9.9
After selecting a split, repeat the same search within each branch. A pure branch has Gini impurity 0 and can become a leaf whose prediction is its most common label. Scikit-Learn’s DecisionTreeClassifier uses the Gini index by default; entropy can be selected instead. section 9.4 section 9.11
A hands-on split
For six credit-card transactions described by value and approved-vendor status, build the first tree node twice: once using Gini impurity and once using entropy. Compare which question each metric prefers. section 9.19








