Google Sheets is a cloud-based spreadsheet workspace for collecting, storing, filtering, visualizing, and collaboratively editing portfolio data. It turns exported holdings into worksheets that expose values, yields, gains, losses, and asset distribution. section 6.0 section 6.2
A portfolio-monitoring workflow uses Google Sheets to:
- Store stock reference data with tickers, share counts, position values, yearly yields, and potential gains or losses. section 6.2
- Summarize total asset value and yield while grouping assets by type for distribution analysis. section 6.2
- Receive exported DataFrames and display live Google Finance values alongside values captured at export time. section 6.5.1
Exporting a stock worksheet
A Python workflow authenticates with a protected JSON key, selects a worksheet, and writes column headers plus DataFrame values. It can then add GOOGLEFINANCE formulas using each ticker and the row’s share count, allowing live position values to be compared with exported values. section 6.5.1
Figure 6.3 A reference example of the Google Sheets worksheet with stock information

Inspect the worksheet layout showing stock information, filterable columns, position metrics, and live values. section 6.2
Figure 6.4 Overview worksheet with assets grouped by value (USD column) and passive income (Yield column)
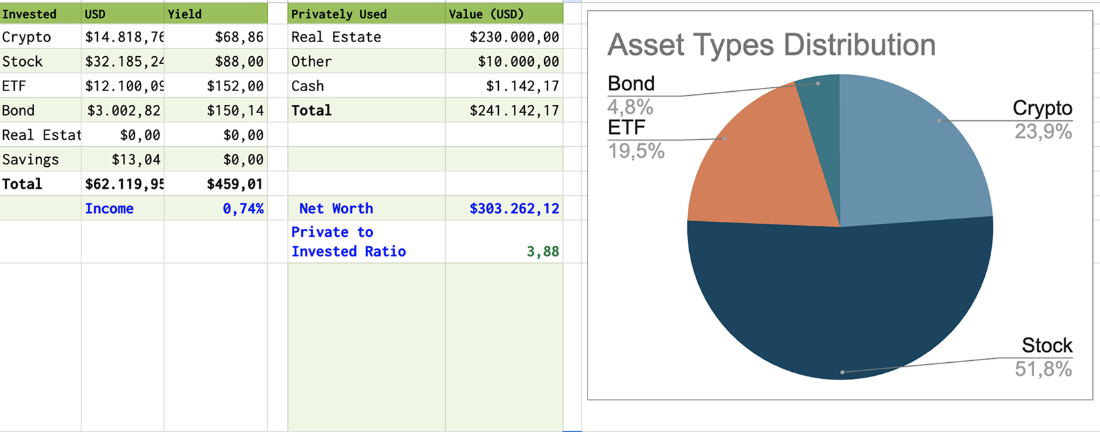
Inspect the overview layout showing asset values, passive income, and asset-type distribution. section 6.2