Granularity, or grain, is the level of detail represented by each row of data. A record might describe one patient’s visit, one user, or an organization. Before calculating a metric, decide which unit matches the behavior you want to measure and the decision stakeholders need to make. section 7.3.1 section 6.2.3
Choose and check the grain before aggregating:
- Name the unit of measurement. A page view, a checkout flow, a returning user, and a company’s users answer different questions; user and organization levels may also form a hierarchy. section 6.2.3
- Inspect the available records. Determine whether data is already aggregated, what timestamps mean, and whether edits have overwritten earlier states; these affect what can be measured over time. section 6.2.3
- Choose a grouping that retains useful differences without overwhelming stakeholders. Country-level results can hide local detail; zip-code results can introduce more detail than a decision needs. section 7.4
- Choose a time period that fits the process. Quarterly aggregation may suit a workflow lasting about two months, while a quarterly metric may hide the effect of a two-week A/B test. Consider seasonality and noise as well. section 7.2.1
Users or customers?
At a business-to-business company, activity can be measured across all users or grouped by customer and month. Decide whether the question concerns user activity or differences among customer organizations before calculating a rate; the grouping determines which distinctions remain visible. section 7.3.1
Figure 7.19 Partially aggregated user activity data by customer and month
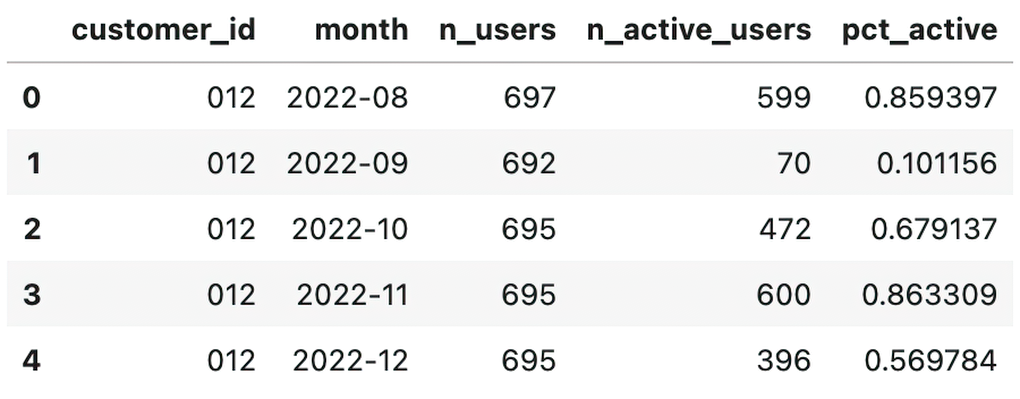
Partially aggregated activity by customer and month makes the chosen grouping visible in the data. section 7.3.1
The chosen grain also matters when preparing shared tables. Partially aggregated data, such as company metrics by week, can be easier for stakeholders to use directly. Keep the underlying question and the table’s grain aligned so a convenient dataset does not silently determine the metric. section 11.3.1 section 7.3.1