Granularity, or grain, is the level of detail defined by what one row represents. A row might describe one transaction, one day of activity, one account snapshot, one fruit, or one hotel reservation. Knowing the grain prevents accidental mixing of detailed and aggregated data—and helps catch duplicates before they distort totals. section 3.5.1 section 8.1
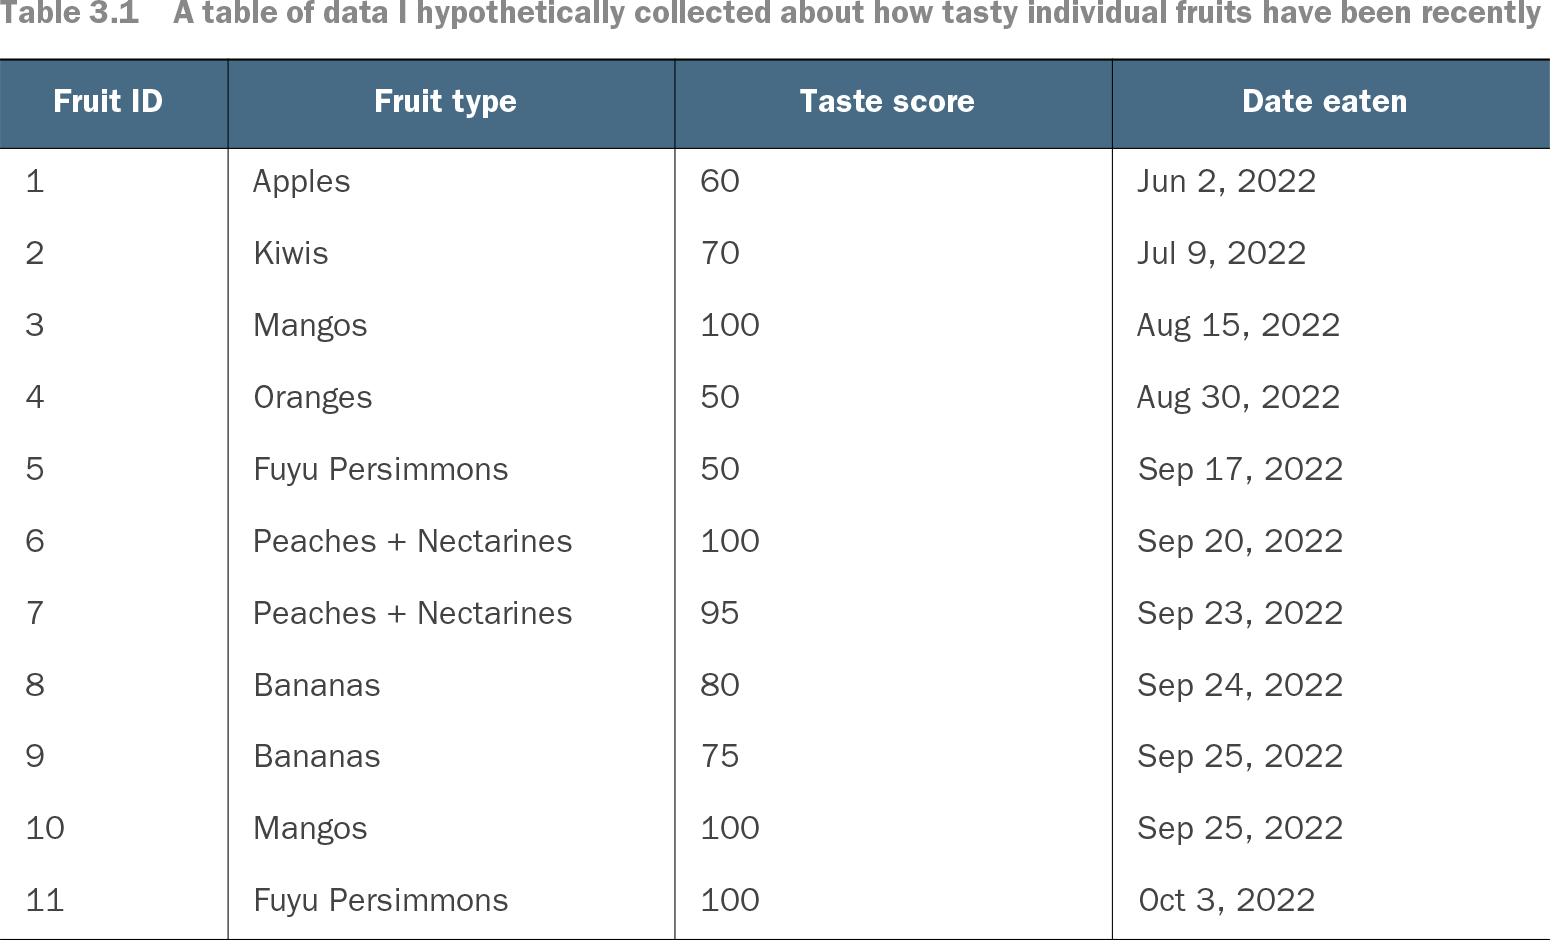
Table 3.1 A table of data I hypothetically collected about how tasty individual fruits have been recently (view table figure)
The fruit table makes grain visible: each row records one fruit observation, with dimensions such as fruit type and date and a measurable taste score. section 3.5.1
Use grain as a quick diagnostic when reading, joining, or aggregating a table:
- Name the row meaning before interpreting its columns or building a visualization. section 3.5.1 section 3.6
- Distinguish detailed rows from summaries: transaction-level data can be aggregated by day, while daily totals cannot automatically restore individual transactions. section 3.5.1 section 3.6
- Treat tables with different grains differently, especially when joining or calculating totals; a duplicated row can create serious errors. section 3.5.1
One fruit table, two grains
The detailed fruit table has one row per fruit. The aggregated table behind the bar charts has one row per fruit type and a summarized taste score. Both are valid, but they answer different questions because their grains differ. A hotel reservation table similarly uses one row per reservation, with stay duration, dates, guests, room type, and property. section 3.5.1 section 8.1