A fraud ring can move funds through several accounts while each transaction appears ordinary on its own. Graph analytics looks for the relationships that transaction-by-transaction scoring can miss. It represents customers, accounts, devices, and other entities as nodes; transactions, shared devices, and similar connections become edges. Investigators can then ask not just what happened, but who is connected to whom and how. section 9.0 section 9.1
To prepare a fraud graph:
- Identify sources that record entities or relationships, such as transaction databases, customer records, device logs, and IP logs. Inspect schemas, identifiers, missing values, inconsistencies, and volumes before linking records. section 9.2.3
- Design the schema around the fraud question: choose node types, edge types, and properties such as transaction amount and timestamp. Select a directed, undirected, weighted, or heterogeneous representation to suit the pattern being investigated. section 9.2.3 section 9.6
- Define the extract, transform, and load flow; import the data and check that the resulting graph is ready for analysis. Unique entities can become nodes, with edges created from their co-occurrence in transactions. section 9.2.3 section 9.6
The analysis depends on the question. Community detection, including Louvain and Leiden, finds densely connected groups that may indicate collusion. Centrality measures can identify influential nodes or bridges in illicit flows; path analysis can reveal unusual routes for money movement. Multi-hop analysis can expose connections between apparently unrelated applicants and a shared device. These are investigative signals, not proof that every connected entity is fraudulent. section 7.4.3 section 9.1
Inspecting a transaction network
Build a graph from tabular e-commerce transactions with Python’s NetworkX, explore its connections, then apply community detection to locate potentially suspicious clusters. Visualizing a cluster can reveal a bottleneck, such as many users sharing one IP address, that is hard to see by reading transaction rows. section 9.3 section 9.6
Figure 9.2 A structured workflow for preparing graph data for fraud analytics. Creating graph data from raw financial sources involves a sequence of deliberate steps, beginning with identifying and analyzing the relevant data, designing the graph schema, and defining the data flow. After the data is imported into the graph environment, post-processing tasks ensure the data is accurate and ready for downstream analysis. This structured pipeline provides a foundation for graph-based fraud detection techniques.
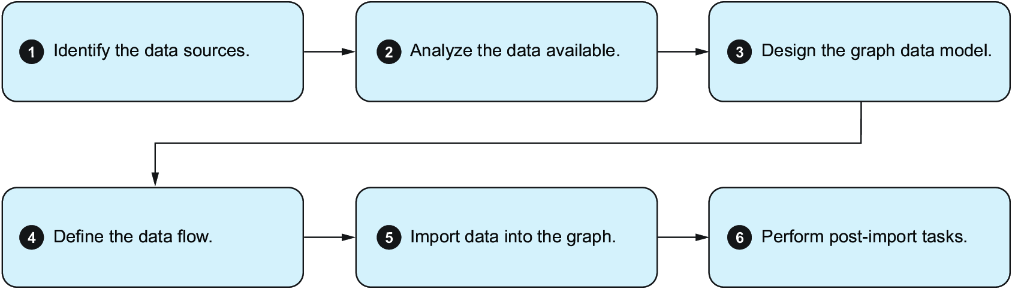
The workflow diagram traces graph preparation from source selection and schema design through data flow, import, and post-processing. section 9.2.3
Graph analytics complements supervised fraud models and unsupervised anomaly detection rather than replacing them. Graph neural networks extend relational analysis by learning from node attributes and graph structure, but large graphs, imbalanced data, and explainability create implementation challenges. Visual network views can help human investigators interpret suspicious structures. section 9.6 section 9.1
