In an A/B test, a statistical test helps decide whether an observed difference is more than noise. The null hypothesis assumes no difference between group means; the alternative says the difference is statistically significant. A p-value measures how likely the observed statistic, or a more extreme one, would be if the null were true. Compare it with a chosen significance level, often α = 0.05. section 12.2.4
Choose and check the test against the experiment:
- A t-test is common; Welch’s t-test is an option when the two groups’ variances are unequal. section 12.2.4
- Test choice depends on the experiment and data; a detailed selection guide is outside this treatment. section 12.2.4
- Simulate groups at the planned sample size, rerun the test 1,000–10,000 times, and use rejection rates to estimate sensitivity and type II error. section 12.2.5
Figure 12.8 Simulation provides a final validation that everything is correct and set up to run an A/B test.
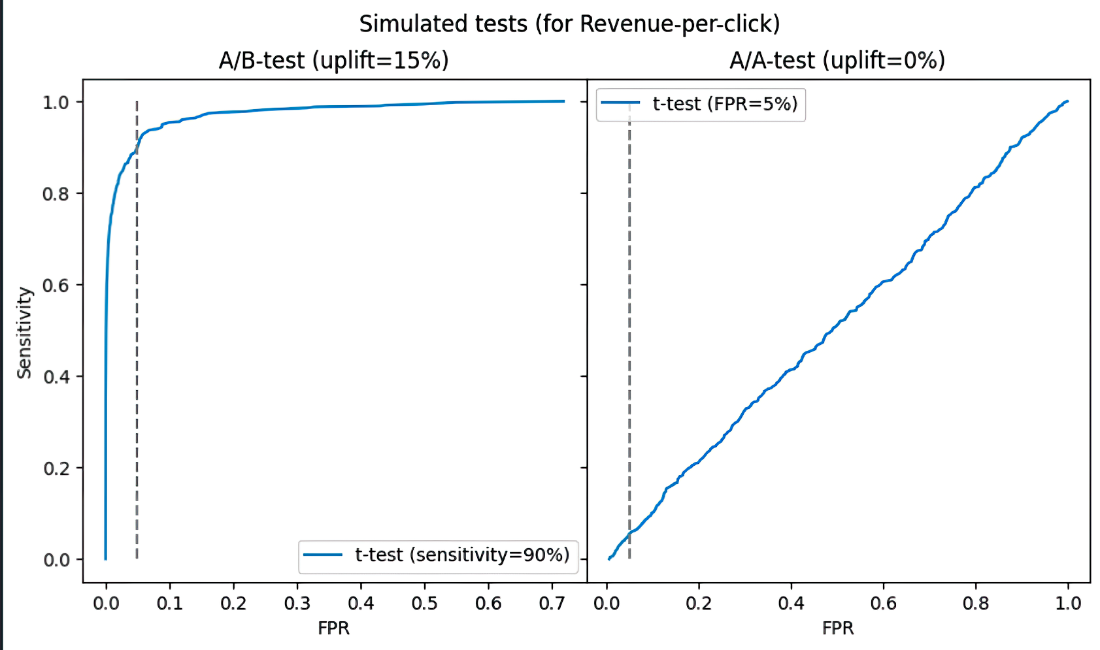
Use the simulation figure as a final check that the test and sample size are set up appropriately for an A/B test. section 12.2.5
Beyond experiments, statistical tests can help detect changes in model predictions or input-data distributions during monitoring. section 14.4.3



