An inflation-adjusted dollar expresses an earlier monetary amount in the purchasing power of a later reference year. Comparing nominal and adjusted amounts separates price changes from changes in the underlying spending level. section 10.3 section 10.2
The adjustment makes NBA salaries from different seasons easier to compare. A salary cap below $60 million in 2010 becomes approximately $70 million in 2021 dollars, because the later-dollar figure reflects changed purchasing power. section 10.3
A practical comparison workflow keeps the monetary series aligned by season:
- Import real and adjusted salary columns, retaining the season as a common identifier. section 10.2
- Reshape wide season columns into long tables with one season-value row, then combine real and adjusted series. section 10.3
- Plot both series with separate line styles and readable dollar labels so nominal growth and purchasing-power differences remain visible. section 10.3
- Group adjusted salaries by postseason classification to compare spending in a consistent monetary frame across seasons. section 10.4.3
Comparing NBA team payrolls
Across the 2000–2017 seasons, average adjusted payrolls were approximately $78 million for teams missing the playoffs, $85 million for playoff teams, and $88 million for champions. These comparisons describe spending in 2021 dollars rather than the dollars actually paid during each season. section 10.4.3
Figure 10.1 The NBA salary cap in USD and 2021 USD between 2000 and 2017. For instance, the salary cap in 2010 was just under $60 M. Converting that figure to 2021 dollars, the cap becomes approximately $70 M, which is why the two lines eventually converge. Whether we view the cap in real dollars or when adjusted for inflation, player salaries have more or less skyrocketed since 2000.
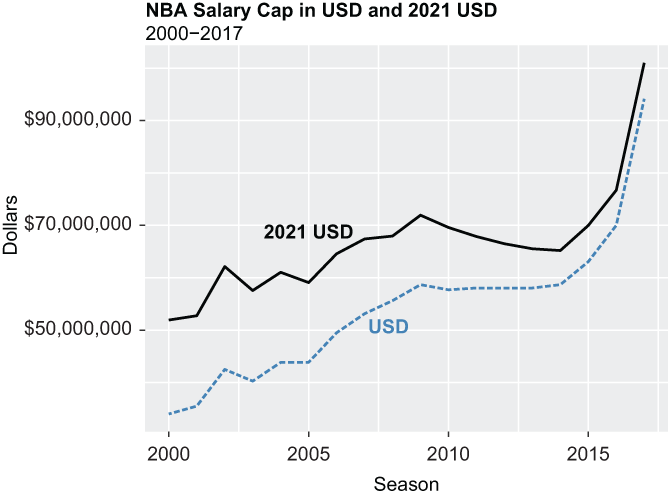
Compare the NBA salary cap in USD and 2021 USD from 2000 through 2017; the paired lines show how inflation adjustment changes historical magnitudes. section 10.3
