A salary cap is the maximum amount an NBA team may spend on player salaries in a season, subject to allowable exceptions. It provides a practical benchmark for comparing team payrolls across seasons. section 10.3
Salary-cap analysis typically distinguishes:
- Real dollars, which report the historical salary-cap amount for each season. section 10.2
- Inflation-adjusted dollars, which restate past caps in 2021 dollars for more meaningful comparisons. section 10.2
- Team payroll, which can be compared with the cap while recognizing that payroll data may contain missing team-season values. section 10.2
Plotting cap growth
Import cap data with cap <- read_csv("salary_cap.csv"), then draw separate ggplot2 lines for real and adjusted values. The resulting comparison shows a 2010 cap just under $60 million, or approximately $70 million in 2021 dollars. section 10.3
Figure 10.1 The NBA salary cap in USD and 2021 USD between 2000 and 2017. For instance, the salary cap in 2010 was just under $60 M. Converting that figure to 2021 dollars, the cap becomes approximately $70 M, which is why the two lines eventually converge. Whether we view the cap in real dollars or when adjusted for inflation, player salaries have more or less skyrocketed since 2000.
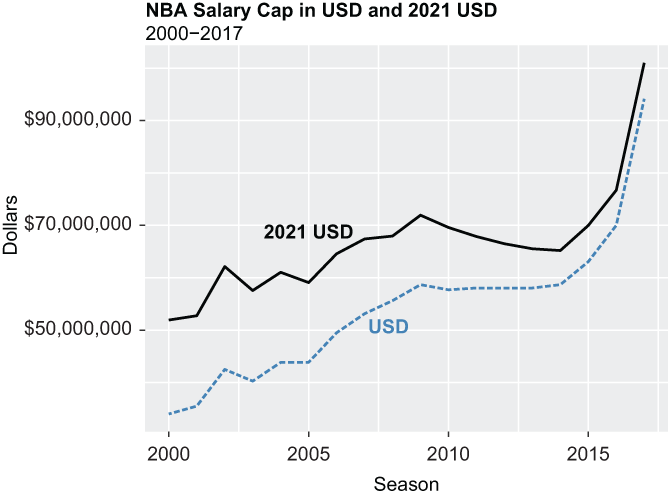
Use the figure to compare nominal and inflation-adjusted NBA salary-cap growth from 2000 through 2017. section 10.3
