Information is data organized to reveal a meaningful insight. It is the first interpretive step in the DIKW pyramid: raw data becomes easier to understand when analysis identifies what matters, but fuller context belongs to knowledge and a call to action belongs to wisdom. section 1.4 section 1.5
A chart alone is not necessarily information. A visual that merely repeats a table may add no insight. Start instead with the audience: identify who needs the story, what they need to know, and which data are relevant. Then state the finding in terms the audience can use. section 1.4.1 section 6.5
Turn data into information through a focused progression:
- Inspect the data for a significant pattern, relationship, unusual event, or apparent conflict. section 6.1 section 6.5
- Reduce or reshape data when that makes the intended comparison readable, such as filtering incomplete boundary years, grouping values, or calculating percentages and changes from a baseline. section 2.3.1 section 3.3.1
- Make the insight explicit with an appropriate chart, visual emphasis, labels, and annotations rather than requiring the audience to perform the calculation. section 2.3.1 section 3.3.1
- Separate the insight from its explanation: add surrounding circumstances as context only when moving from information to knowledge. section 1.4.2
Pet-event participation
Counts show 1,138 cats, 130 dogs, and 17 other pets. A basic bar chart simply redraws those counts. Removing the irrelevant Other category and calculating shares produces the usable insight: about 9 of 10 participating pets are cats and 1 of 10 is a dog. Advertising-site counts and participation rates can then explain that result as context. section 1.4.1 section 1.4.2
Tourist arrivals
A raw multi-country line chart is crowded, yet it suggests that arrivals increased after 1990. Restricting analysis to complete years, summing arrivals by year, calculating each country’s percentage increase since 1994, highlighting Portugal, and labeling the end values turns the broad trend into a clearer message. section 2.3.1
Information can come from deliberate inquiry as well as calculation. Look for connections among details, coincidences, curiosity-provoking anomalies or missing values, and contradictions. More than one strategy can apply at once. For salmon aquaculture exports, a trend exposed sales growth after 1998 and an earlier decline, prompting investigation of the decline. section 6.1 section 6.4
In a data story, information supplies the main point. Build from that point outward: establish the background needed for understanding, then identify next steps or invite action. This prevents presentation choices from obscuring the central insight. section 5.2.1 section 1.4.3
Figure 1.8 The DIKW pyramid
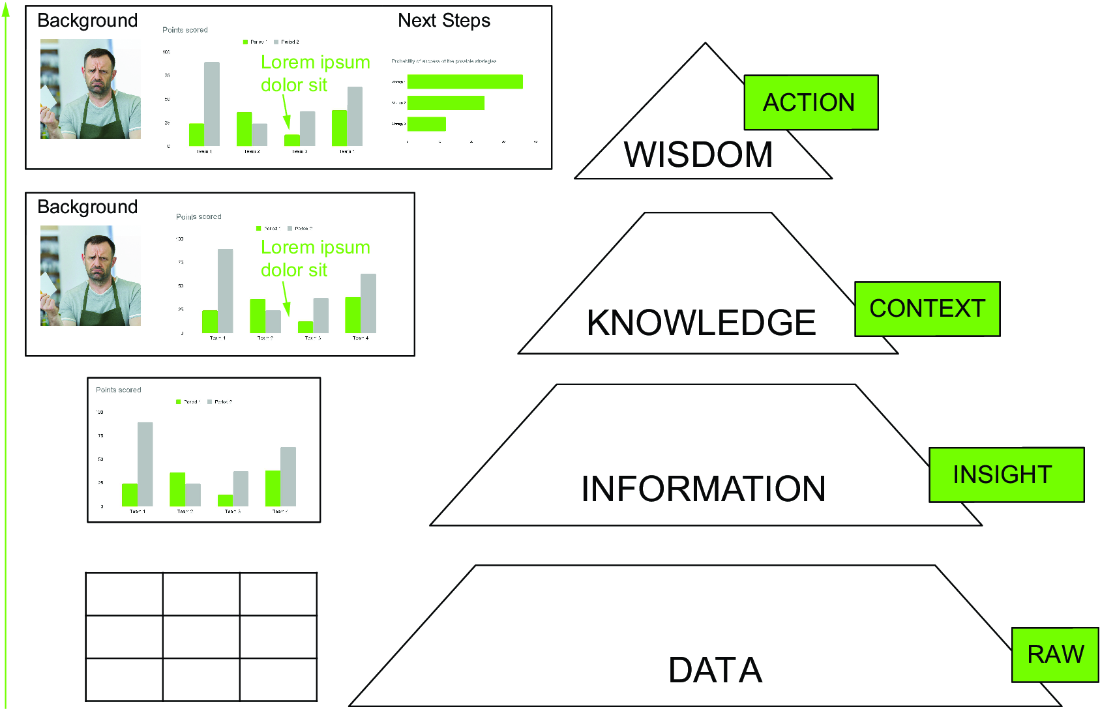
Use the DIKW pyramid to locate information between raw data and contextual knowledge, before the action-oriented wisdom stage. section 1.4
