An intervention distribution describes outcomes after fixing a treatment value, rather than observing natural treatment assignment. P|do(T = A) asks what recovery would look like if everyone received treatment A. section 2.3
This differs from a conditional probability: conditional probabilities describe what was observed, while intervention distributions estimate what would happen in a changed scenario. The construction mimics a hypothetical randomized controlled trial, where treatment is assigned independently of confounders. section 2.3 section 4.0
Kidney-stone treatment
Kidney-stone size can affect both treatment choice and recovery, creating confounding in observed data. To represent an RCT, remove the arrow from size to treatment; estimating P|do(T = A) then represents assigning treatment A to everyone and measuring the resulting recovery rate. section 2.3
Figure 2.7 Graph depicting an RCT. In an RCT, various factors may influence the outcome, but none influence the treatment, as the treatment is assigned randomly. This means there are no confounders.
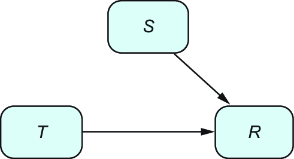
Use the RCT graph to see how random treatment assignment removes confounding arrows while other factors may still influence the outcome. section 2.3

