An interview is a structured conversation for learning what stakeholders and users need, know, and experience. In visualization work, it anchors research and feeds the requirements that define what to build and why. section 8.2
Start by separating two roles: stakeholders request the work and usually judge its success; users will use the visualization. They can be the same people, but when they are not, getting to know users may require extra legwork. section 8.2
Keep early conversations practical and human:
- Record the session so you can concentrate on the conversation; if that is not possible, arrange thorough note-taking. A short pencil is better than a long memory. section 8.2.1
- Put people at ease rather than treating the exchange like a rapid-fire press conference. Smile, breathe, and begin as one person talking with another. section 8.2.1
- Gauge data literacy early. Ask about reports or apps people already use to follow information important to them, rather than asking them to rate their own skill. section 8.2.1
A stakeholder who is also a user
A manager may request a dashboard for a team without using it personally, while an internal-report requester may be a user too. The distinction changes who needs to be interviewed, even when the overall process remains similar. section 8.2
Figure 8.1 The research and planning phase consists of four steps: interviewing stakeholders and users, finding the data, documenting the requirements, and getting feedback and approval on those requirements.
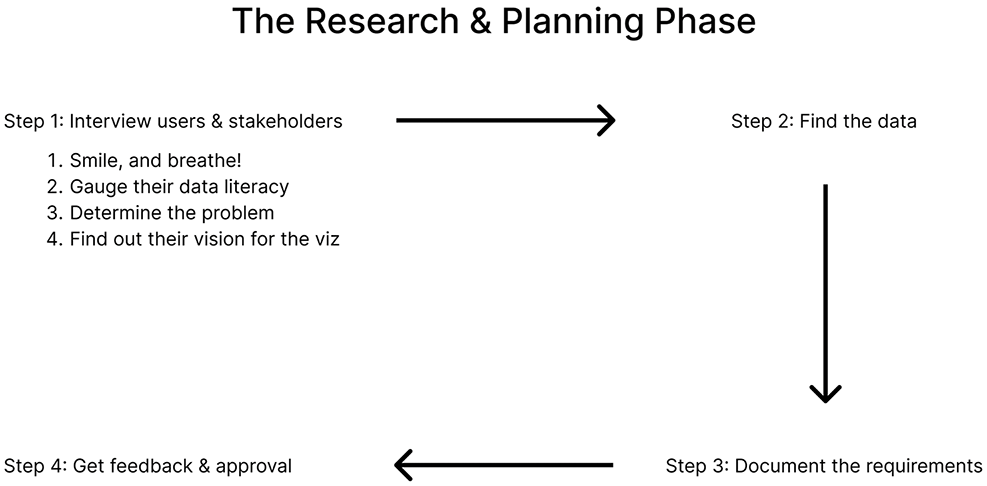
Use the research-and-planning sequence to place interviews before data discovery, requirement documentation, and feedback or approval. section 8.2