K-means groups observations with similar numeric features into k nonoverlapping clusters. Each observation belongs to one cluster, identified by its nearest center, or centroid. It is useful when, for example, a retailer wants to find customer segments without supplying a target variable. section 2.3.1 section 2.10
The algorithm alternates between assignment and recalculation:
- Choose k, the number of clusters, and initialize k centers. section 2.3.1
- Assign every observation to its nearest center. section 2.3.1
- Move each center to the mean of its assigned observations, then reassign observations. Repeat until the clustering no longer improves. section 2.3.1
Figure 2.6 Step 1 represents the raw dataset. In step 2, the algorithm initiates three random centroids as we have given the input of the number of clusters as three. In step 3, all the neighboring points of the centroids are assigned to the same cluster.
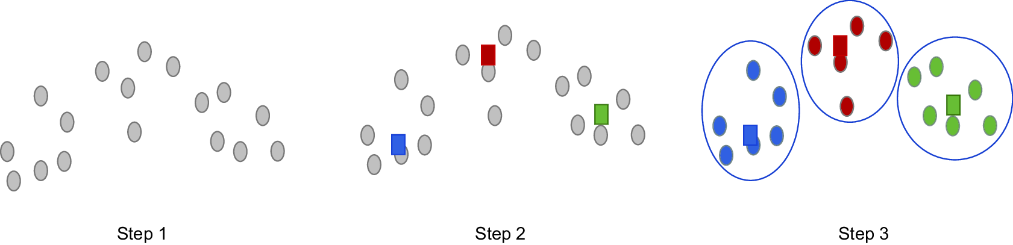
The diagram makes the first assignment visible: three initial centroids produce three groups of nearby points. Later recalculations can change those assignments. section 2.3.1
Cluster vehicles in Python
Load the vehicle data into a pandas dataframe and check its shape, variable types, sample rows, class counts, and missing values. Exclude the class column from the clustering features. Standardize the remaining features with StandardScaler so a large-valued dimension does not dominate distance calculations. Plot average Euclidean distortion across candidate k values to look for an elbow; the illustrated fit uses KMeans(n_clusters=3, n_init=15, random_state=2345) on the standardized data. Inspect cluster_centers_, labels_, label counts, and a cluster-colored plot to understand the result. section 2.3.5
Treat the clusters as a starting point for interpretation, not automatic business categories. Choosing k can be difficult, random initial centers can change the output, and outliers can distort it; run multiple fits and examine the data before accepting a solution. Basic k-means also cannot use categorical variables directly. For customer segmentation, check cluster sizes and distinguishing attributes before naming groups or acting on them. section 2.3.4 section 2.6.4






