K-means clustering is an unsupervised method for segmenting data when no target variable is available. Choose K, the number of groups, and the algorithm assigns every observation to the cluster with the nearest centroid, or mean. It seeks compact clusters with low within-cluster variation and separation between clusters. section 11.0 section 11.5
The algorithm starts with K randomly initialized centroids, repeatedly assigns observations to their nearest centroid, and recalculates each centroid from its assigned observations. It stops when centroids no longer move or a maximum iteration count is reached. Euclidean distance is the usual measure of closeness. section 11.5
A practical K-means workflow is:
- Standardize numeric variables with z-scores so variables on larger scales do not dominate the grouping. section 11.6
- Test candidate values of K with within-cluster sum of squares and average silhouette methods. section 11.5.2
- Run K-means with the selected K, inspect cluster sizes and centroids, then visualize and interpret the groups. section 11.5.2
Choosing K requires judgment. A scree plot can reveal an elbow where larger K values produce diminishing reductions in within-cluster sum of squares, but that bend may be unclear. Average silhouette coefficients, ranging from -1 to +1, offer another check: low values suggest weak clustering. Too few groups can oversimplify patterns; too many can overfit them. section 11.5.2 section 11.5
Segmenting NBA teams by payroll and wins
Standardized team payrolls and regular-season wins from 2000–17 are grouped with K = 4. The output reports cluster sizes, mean payrolls and wins, assignments, and within-cluster sums of squares; a scatterplot makes the four team segments visible. The result supports examining how payroll and winning align, while also recognizing that these variables were not normally distributed, a condition under which K-means works best. section 11.5.2 section 11.6
Figure 11.3 Two solutions on optimal cluster counts visualized, where the plot on the top is a scree plot that represents the within-cluster sum of squares method, and the plot on the bottom represents the silhouette method
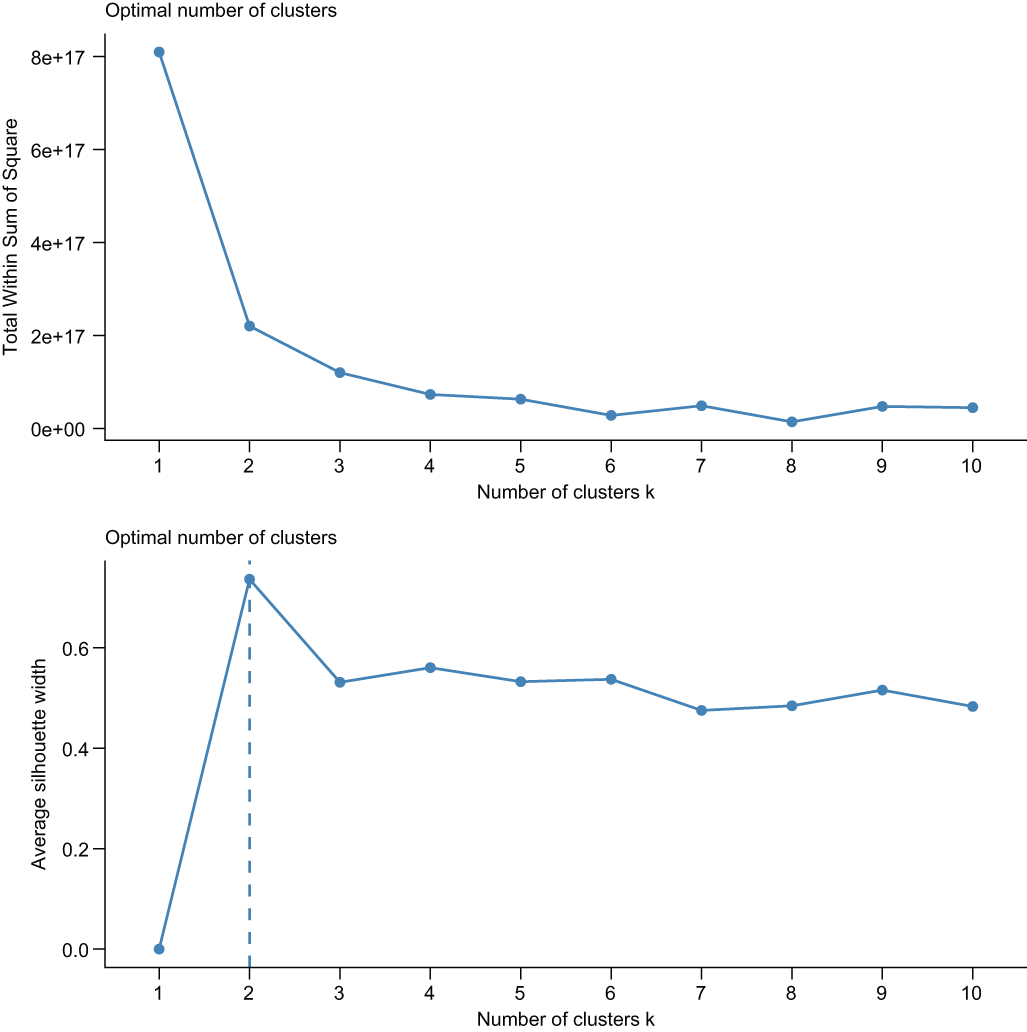
Compare the scree plot and silhouette plot when selecting a defensible number of clusters. section 11.5.2
Figure 11.4 The visualization of our K-means cluster where K equals 4. The clusters are based on a combination of team payrolls and regular season wins, where each variable has been standardized.
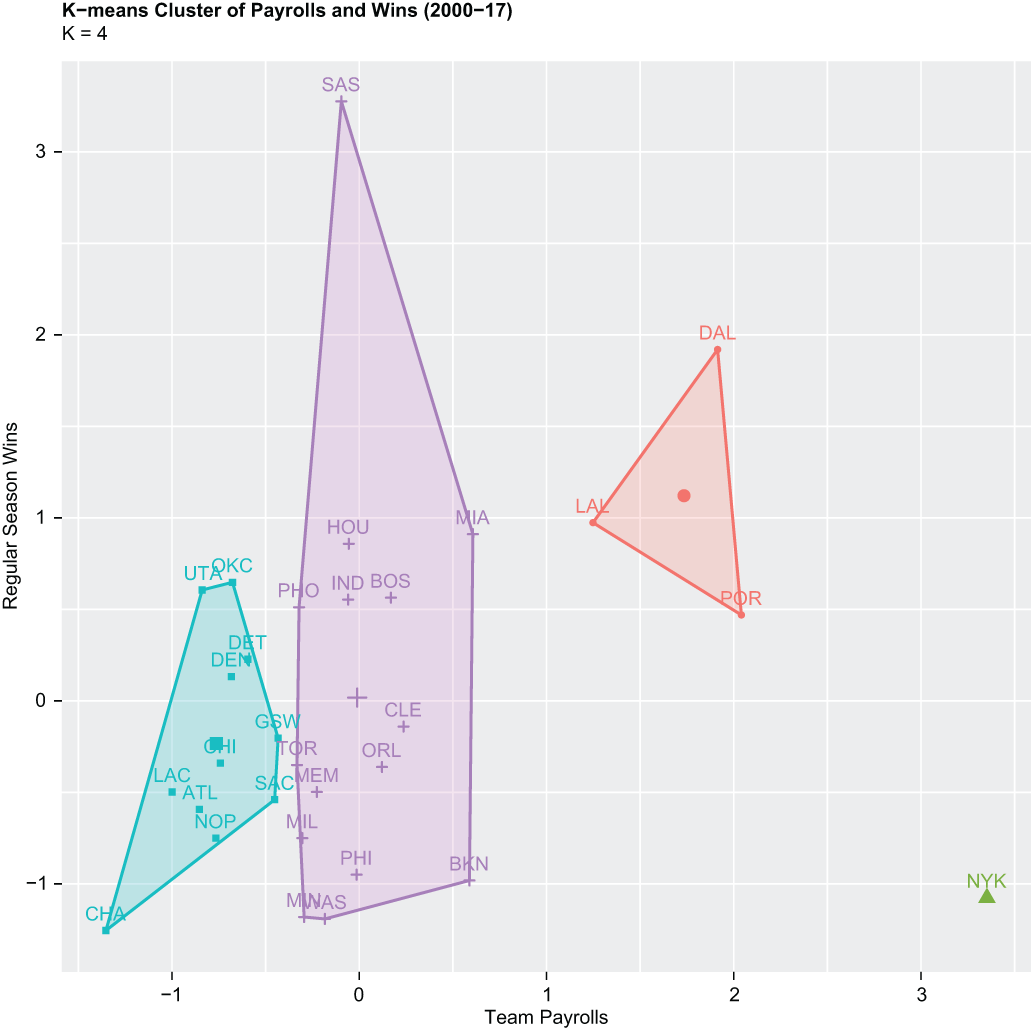
Inspect how standardized payroll and win observations separate into four plotted clusters. section 11.5.2






