The level of significance, written α (alpha), is the cutoff for deciding when sample evidence is unusual enough to reject a null hypothesis. It is the probability area left outside the confidence level: α = 1 − confidence level. A 95% confidence level therefore corresponds to α = 0.05. section 6.5
Think of α as the portion of outcomes treated as sufficiently far from the null-hypothesis expectation. With α = 0.05, rejecting the null hypothesis accepts a 5% risk of rejecting it when it is actually true. A stricter 99% confidence level leaves α = 0.01, setting a higher bar for rejection. section 6.6
How α shapes a hypothesis test:
- Choose whether the alternative hypothesis looks for any difference or for one direction. section 6.15 section 6.8
- For a two-tailed test, divide α across both tails. With α = 0.05, each tail has area 0.025. section 6.5
- Use α to define the critical region. Reject the null when the test statistic enters that region, or when the p-value is less than α. section 6.15
In a two-tailed test, α marks unusual results on either side of the proposed population value. At 95% confidence, the central range of a standard normal distribution runs from about −1.959964 to +1.959964; results beyond those boundaries fall in the α regions. In a one-tailed test, all of α sits in the selected direction rather than being split. section 6.5 section 6.8
Figure 6.2 A critical Z-value of ±1.959964 for a .05 level of significance (alpha)
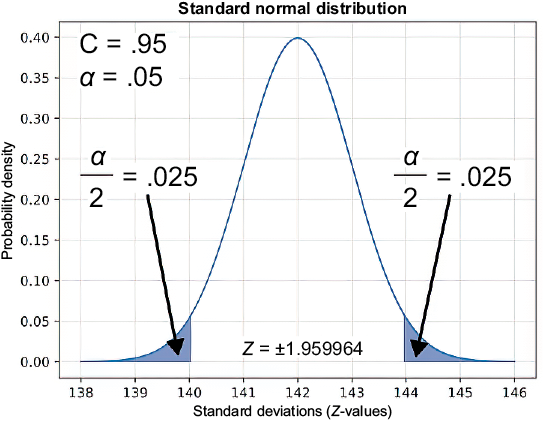
Use the diagram to see why a .05 significance level becomes .025 in each tail of a two-tailed test, while the middle .95 remains the confidence area. section 6.5
Checking potato chip bag weights
Suppose the claimed mean bag weight is 142 g, while a sample of 41 bags has mean 140.2 g and standard deviation 4.79 g. With α = 0.05, the calculated Z-statistic is −2.4062. Because it falls outside the critical range [−1.959964, 1.959964], it lands in a tail region and the null hypothesis is rejected: the sample provides enough evidence that the mean differs from 142 g. section 6.6
Choosing a one-tailed test deserves care. It tests only “less than” or only “greater than,” so it deliberately focuses the analysis in one direction. Two-tailed tests are generally preferred when an effect in either direction matters, particularly in mission-critical settings. section 6.8
