Log aggregation collects logs from multiple services, routes them to centralized storage, and makes them available for querying. It supports debugging and tracing problems in distributed systems by preserving detailed records of events and application behavior. section 5.3.1
Figure 5.8 Most observability platforms, whether open source software or commercial, will use a similar high-level architecture. Specific technology components will be different depending on scale, but understanding this footprint will be important when considering build versus buy options.
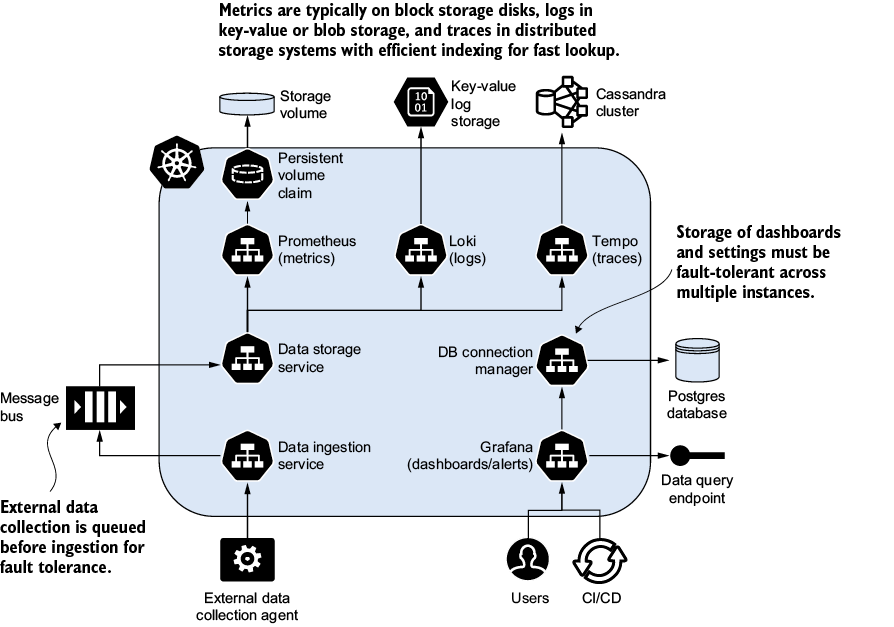
Use the observability-platform architecture to trace how collected logs move through processing, storage, and visualization components. section 5.3.1
A practical observability platform connects aggregation with adjacent operational capabilities:
- Store logs in Loki, using key-value log storage and distributed backends such as Cassandra for throughput, scalability, and reliability. section 5.3.1
- Connect Grafana to logs, metrics, and traces so users and CI/CD pipelines can query data, build dashboards, and configure alerts. section 5.3.1
- Automate collection and provide usable tools, templates, and support so teams adopt aggregation without configuring every service manually. section 5.3.4
Platform-engineering rollout
A central observability platform automatically collects service logs, stores them in Loki, and exposes them through Grafana alongside Prometheus metrics and Tempo traces. Teams receive prebuilt dashboards and support from observability champions, reducing setup friction and helping them resolve production problems faster. section 5.3.1 section 5.3.4