The mode is the most frequently occurring value in a dataset. As a measure of central tendency, it answers “What value occurs most often?” rather than describing the distribution on its own. section 4.1.1
Check what the mode represents before reporting it:
- Look for a high concentration of values that a single value or bin can represent. Report another measure of central tendency, such as the mean or median, alongside it. section 4.1.2
- Inspect the distribution’s shape. Two concentrations may be more informative than a single reported mode. section 4.1.1
- For floating-point data, try rounding to different decimal places and check whether the resulting mode is meaningful to stakeholders. section 4.1.1 section 4.1.3
Sleep and interruptions
In one summary, the mode is 7 hours of sleep and 2 interruptions. The corresponding means are 6.33 hours and 2.4 interruptions; the medians are 7 and 2. Reporting these together puts the most frequent values in context. section 4.1.1
Figure 4.11 A bimodal distribution with two modes around 100 and 130 that are best discovered by visual observation
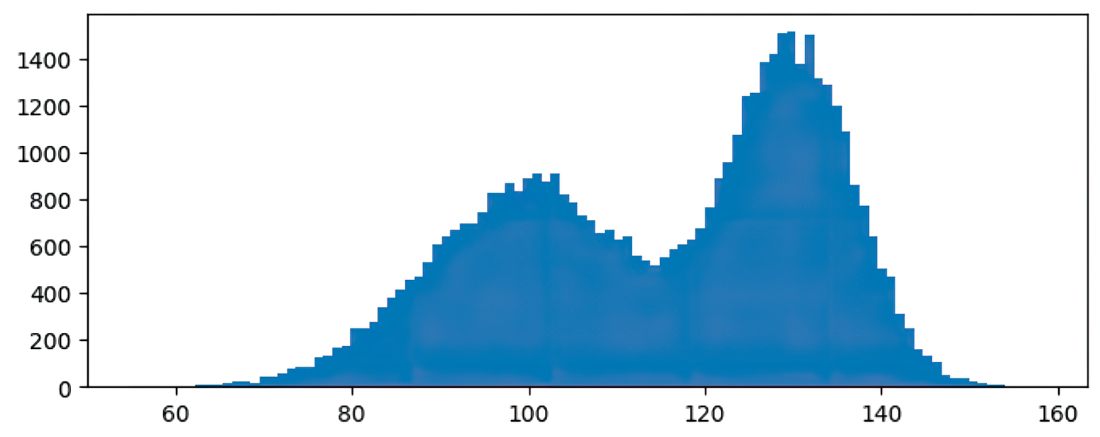
The distribution has two concentrations, around 100 and 130. Seeing both helps prevent a single modal value from standing in for the whole pattern. section 4.1.1
A mode can be useful in a descriptive report or dashboard, but any single summary statistic can mask important features of the data. Examine the distribution and choose measures that support the stakeholder’s question. section 4.1.1 section 3.2.1